SOLUTIONS / DATA CENTER POWER SMOOTHING
Data center power smoothing for AI loads.
AI training moves tens of megawatts in under a second, every 20 seconds or so, thousands of times a day. A battery on the block takes every pulse and the grid draw stays flat. The simulations below run the production control code on a training load shape digitized from a published figure of a GPU training cluster.
01 / THE LOAD PULSE
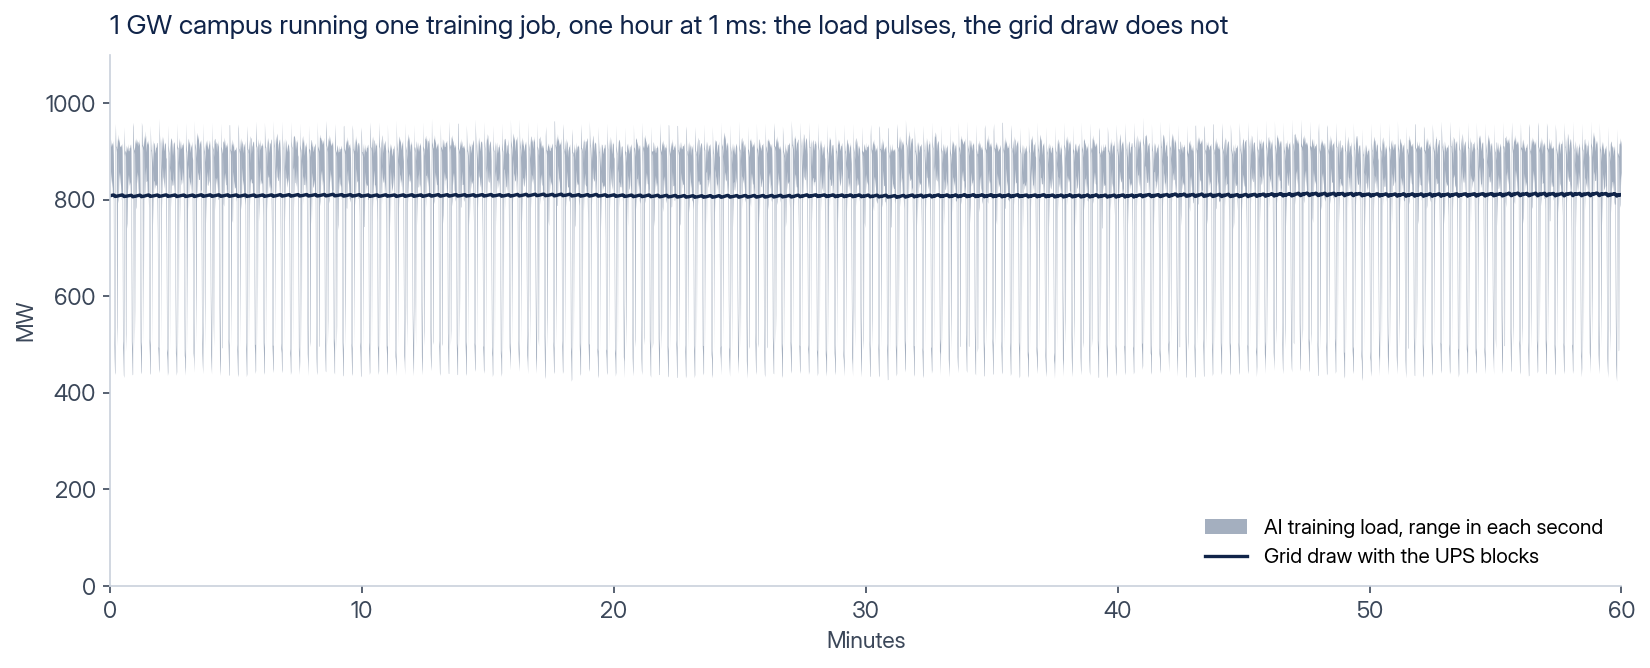
Each training step swings the campus by about 500 MW.
A GPU cluster training a model runs the same cycle over and over: compute, synchronize, compute. Power rises to the cluster’s peak during compute and falls during synchronization. When one job spans a 1 GW campus, the swing is about 500 MW, and it repeats every 20 seconds or so, with shorter dips in between. Utilities see this as flicker, voltage instability and a power oscillation they will not accept at the point of interconnection without mitigation.
02 / ZOOMED IN
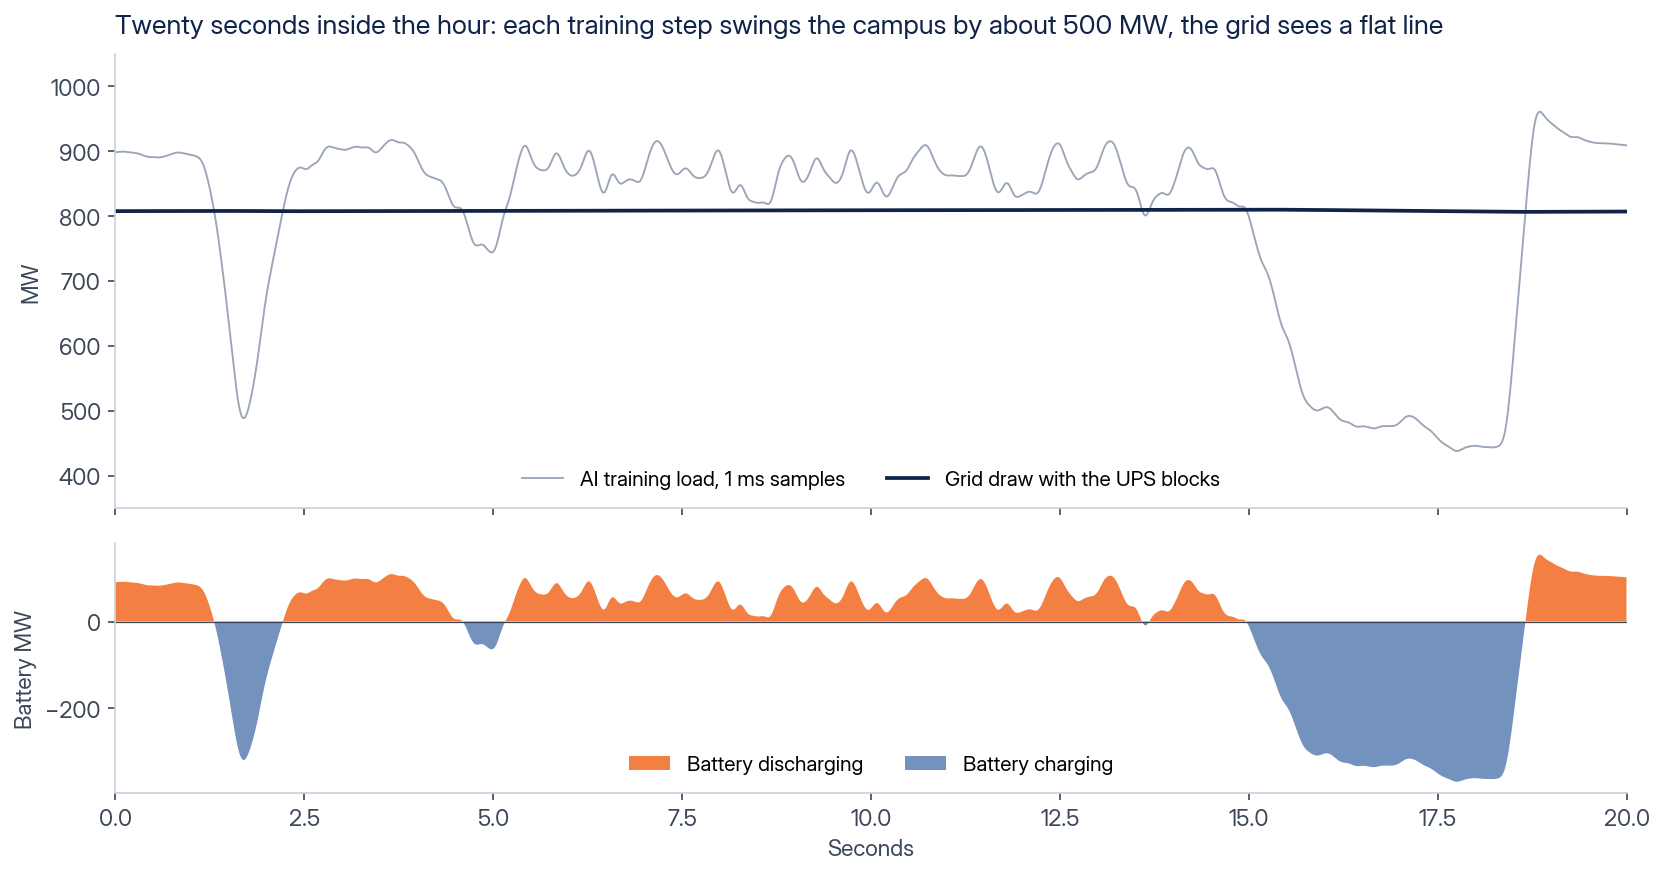
Twenty seconds, every sample.
Zoomed to twenty seconds, the training cycle is visible as a square-edged pulse with sub-second texture. The battery discharges on the rise and charges on the fall, so the sum of load and battery seen by the grid is a flat line. In the dual-conversion topology the load-side converter serves the load as a voltage source, so the pulse never passes through a control loop. A small residual remains at the point of interconnection, 5.7 MW filtered in the 1 GW case, which is why parallel blocks at a 3 ms response read the same. In the parallel topology the blocks sit beside the load and inject the opposite of each pulse through a control loop. The simulation gives that loop a 3 ms total response, from measurement through command to the converter.
03 / POWER VARIATION
ERCOT's proposed 10 MW in 5 seconds, simulated.
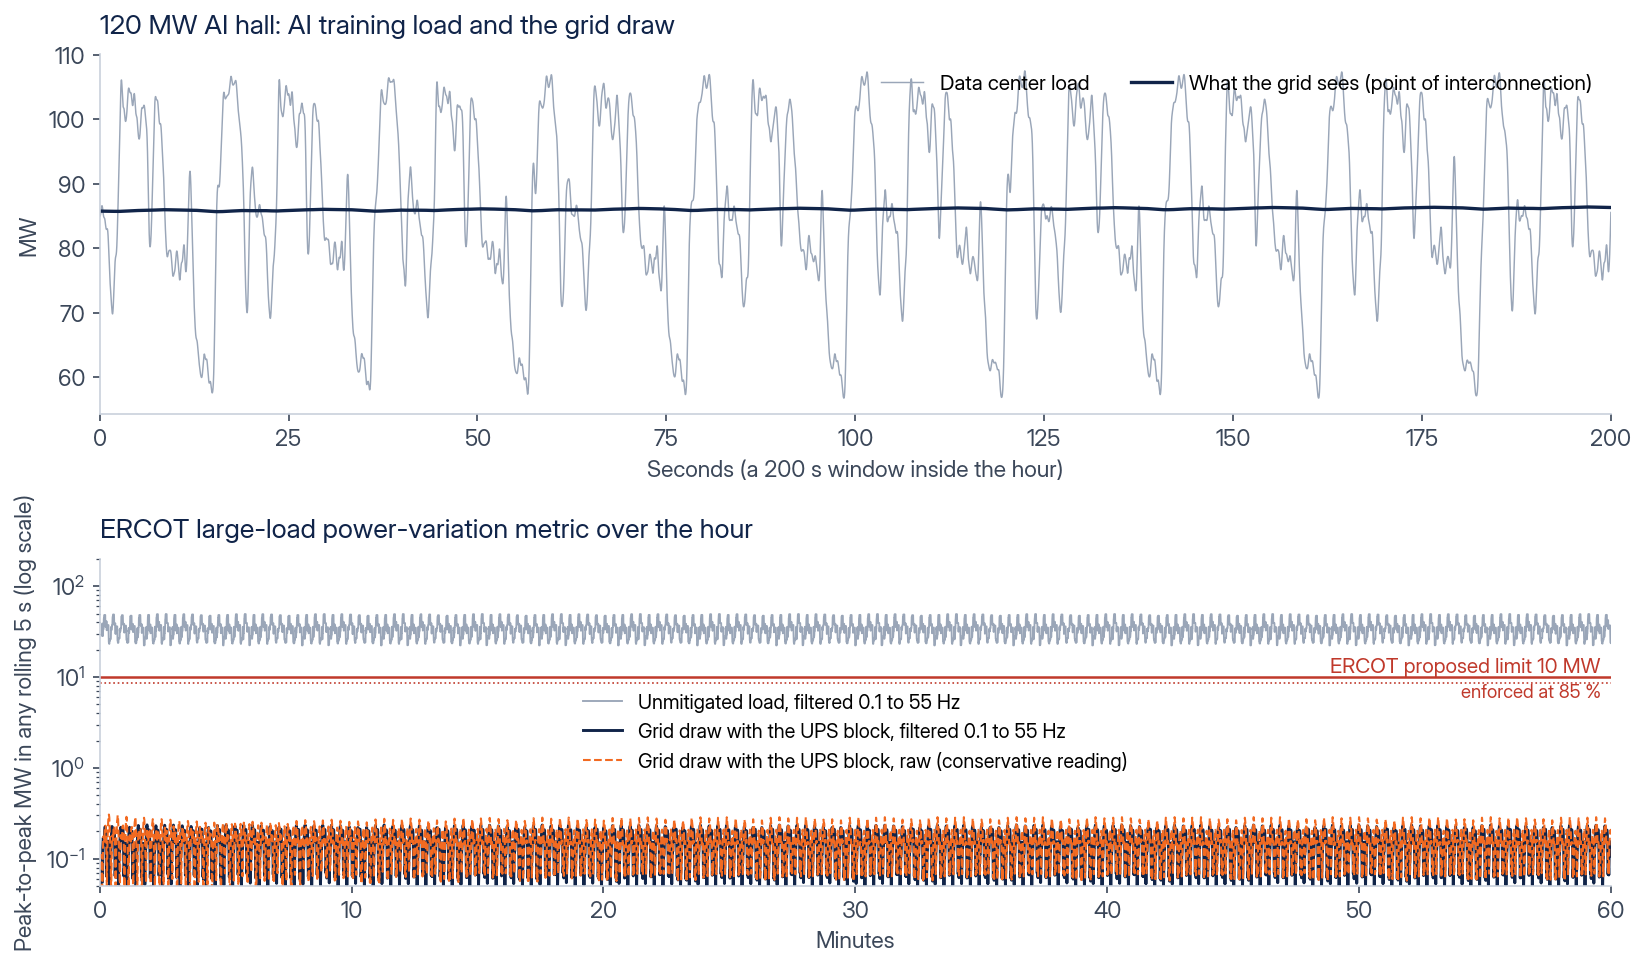
ERCOT has proposed a power-variation limit for large loads: the peak-to-peak change in active power, filtered to 0.1 to 55 Hz, may not exceed 10 MW in any rolling 5-second window. The proposal was presented to the Large Load Working Group in February, April and June 2026. We run the production control algorithm against it at two scales, with the training load shape digitized from a published figure of a GPU training cluster, scaled to each site.
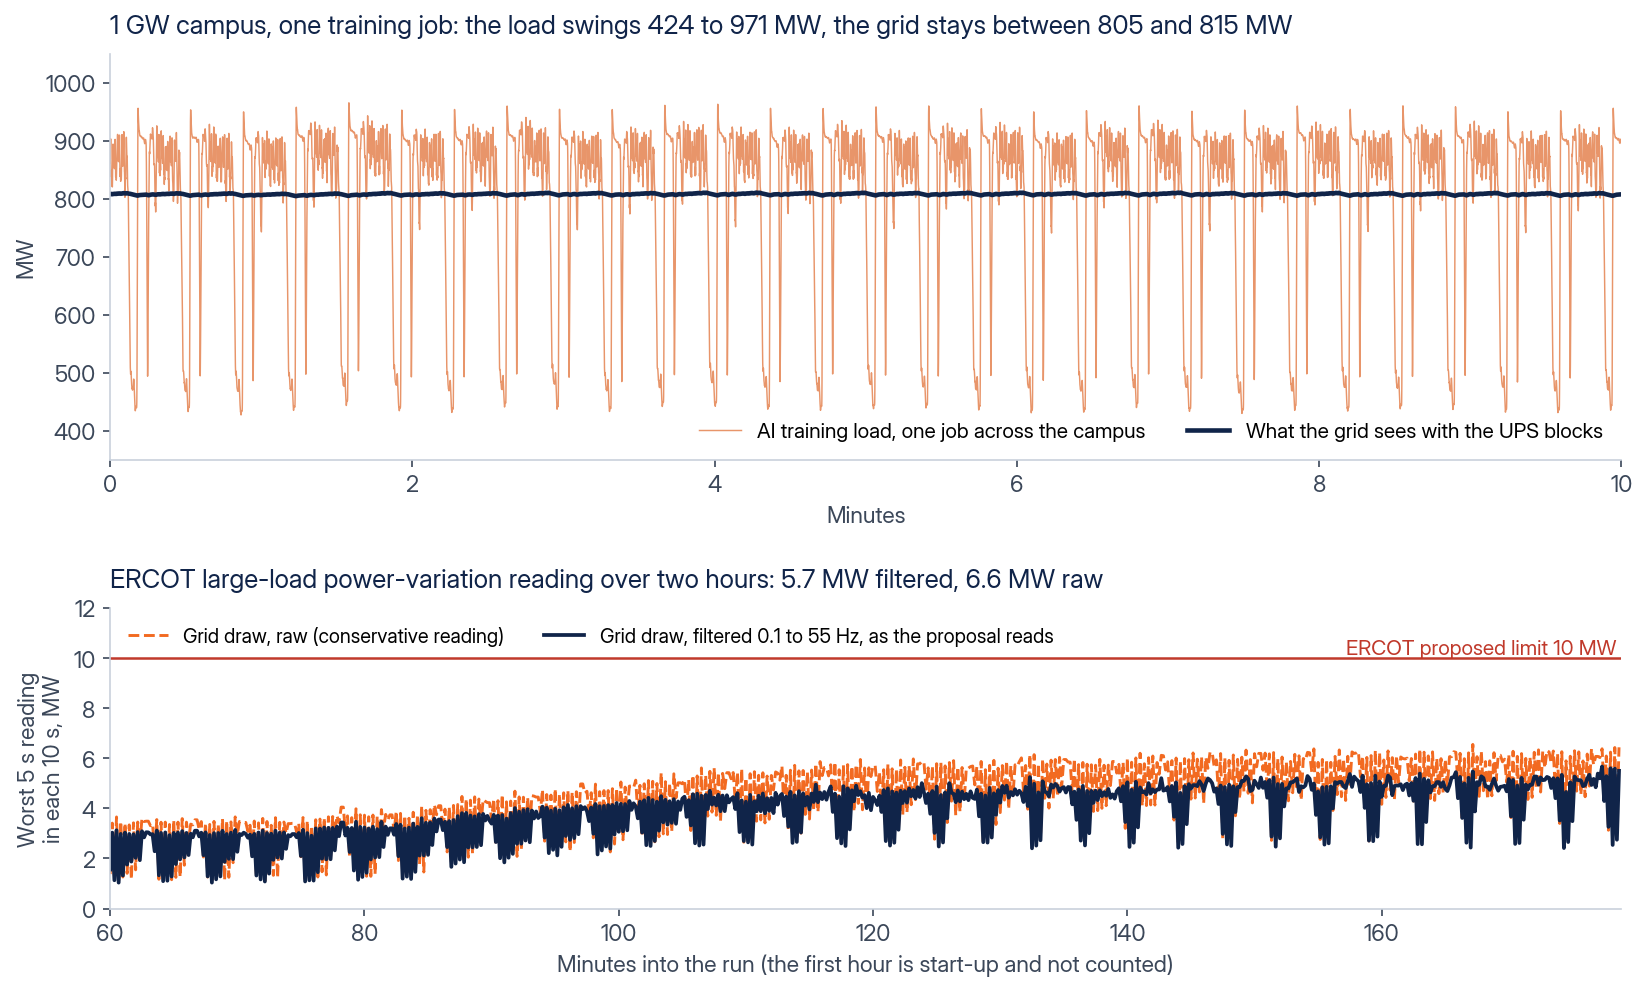
Parallel blocks give the same reading. In the same 1 GW case the grid draw with parallel blocks, at a 3 ms total response, reads 5.7 MW filtered and 6.6 MW raw against the same 10 MW limit.
Basis: the training load shape is digitized from a published figure of a GPU training cluster (Choukse et al., arXiv 2508.14318, 2025) and interpolated to 1 ms for the simulation. It is scaled to a 120 MW hall of four independent jobs with 100 ms of timing spread, and to a 1 GW campus (600 MW of IT, 400 MW of cooling and mechanical load) running one job with 50 ms of spread. In the charts each block is a dual-conversion medium-voltage UPS sized to the load, 2 hours of energy, 70 % state-of-charge target. The parallel reading uses the same 1 GW case with a 3 ms total response. The campus reading is taken over the last two hours of a three-hour run, after start-up. The filter corners at 0.033 Hz and 165 Hz are our assumption, since the proposal does not prescribe the filter. The raw reading, without the filter, is shown as the conservative bound. The rule had not been filed as a protocol revision at the time of writing.
04 / GENERATOR PROTECTION
Pulses that generators cannot follow.
AI load pulses put torsional stress on the shafts of reciprocating engines and gas turbines, and no generator can follow a load that moves 500 MW within a second. A site that runs AI load with behind-the-meter generation, even with a partial grid connection, needs the battery to take the pulses so the generators see a smooth load. Fuel cells and small modular reactors ramp more slowly still, and the battery takes the fast part of the change.
Where the generators connect decides which ones the battery protects. Parallel blocks protect generation that shares their medium-voltage bus: on-site prime generation, or medium-voltage standby generators. Low-voltage standby generators behind a hall’s own transfer switch are outside the blocks’ path once the hall transfers. With dual conversion, generation upstream of the blocks sees the grid-side converters’ slow average.
The same control also damps power oscillations between the load and the supply, with configurable settings for flicker mitigation and oscillation prevention. The data center interconnection page covers ramp rate control and on-site generation. Request information with your load profile and its time resolution to see your site simulated.
YOUR PROJECT
Request information
Tell us what you are evaluating. An engineer will review your request.
Request information
Request received.
An engineer reviews every request and replies to approved company addresses within one business day.
Your email draft is ready. Send it to complete your request. If your mail client did not open, open the request email or email contact@battalion.energy from your company address with the same details.