PLATFORM / Plan

Energence

The energy intelligence platform.

Energence is Battalion’s energy intelligence platform for project planning, energy data, modeling, optimization and data center studies.

Talk to us about Energence ↗
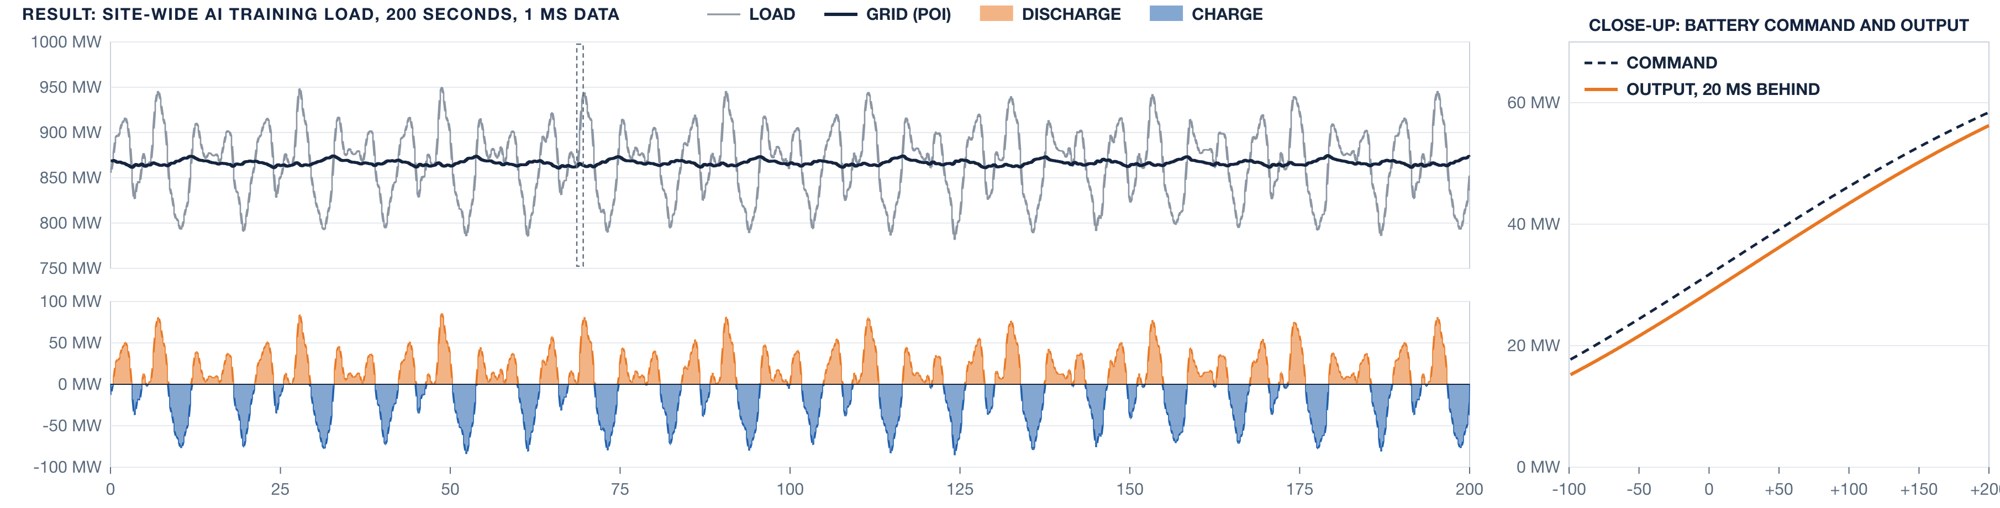
Battery smoothing simulation, with raw load, smoothed connection power, battery power and charge state.
EnergenceBattery smoothing simulation, with raw load, smoothed connection power, battery power and charge state.
PLANNING, DATA AND MODELING
✦

Plan the project

Bring the site, energy data and project assumptions into one platform, including the data center viewer.

✦

Model the duty

Compare battery sizing, grid-facing power, ride-through reserve and the effect of repeated cycling.

✦

Optimize the project

Evaluate tariffs, market programs and operating strategies alongside battery life and warranty constraints.

THE PLATFORM

An energy intelligence platform, powered by Battalion's battery optimizer.

Energence is Battalion’s energy intelligence platform. It is powered by our battery optimizer, the engine that sizes, dispatches and values a battery against tariffs, market programs and battery life.

Behind it is what we have accumulated since 2016: more than 10 TB of market, grid and site data, covering more than 25 power markets across the Americas, Europe, Asia and Australia, with their market rules, a utility tariff database and live data streaming from the grid operators. AI price and load forecasting and bid optimization run on top.

AI agents work inside the platform with the same tools our analysts use. They screen sites, build project models, run the optimizer and draft the response to a request for proposal.

A few views from inside.

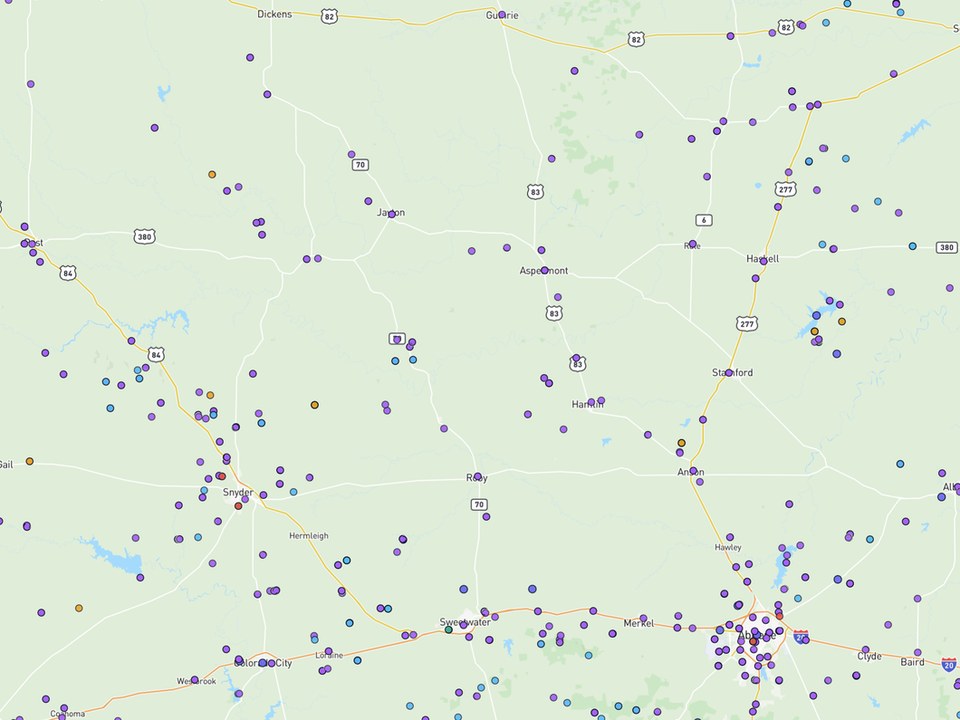
Site screening for utility-scale storage
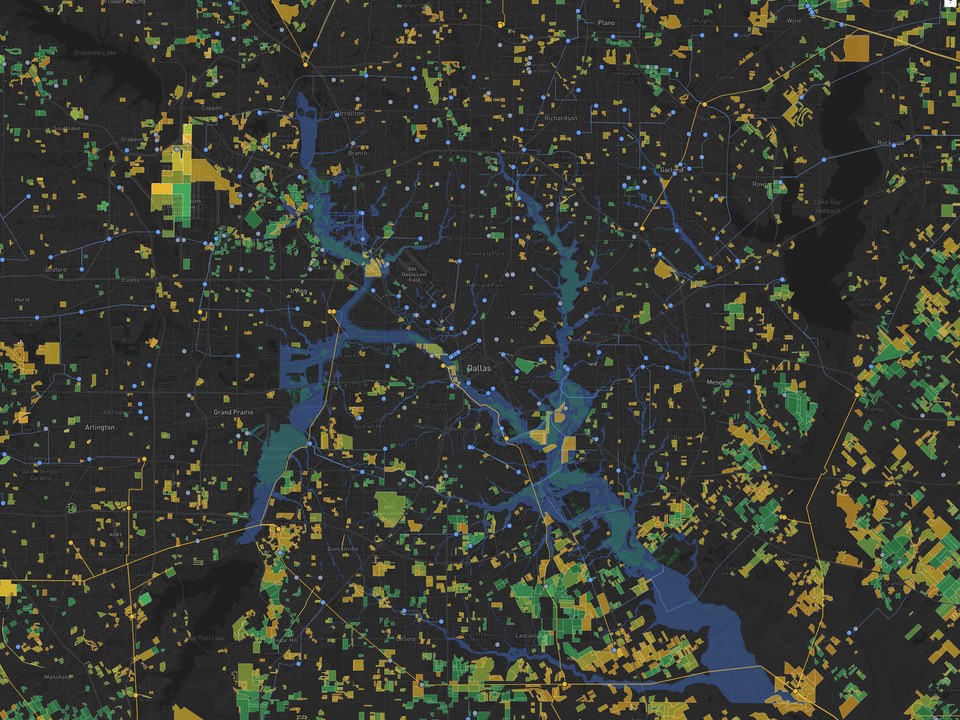
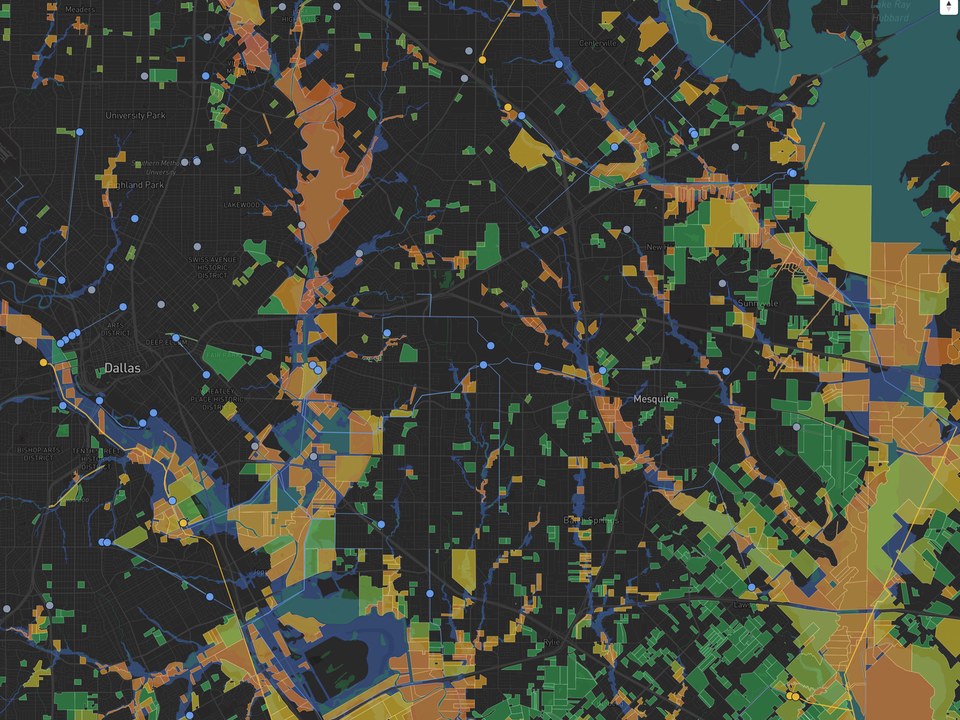
Parcel screening for data center sites
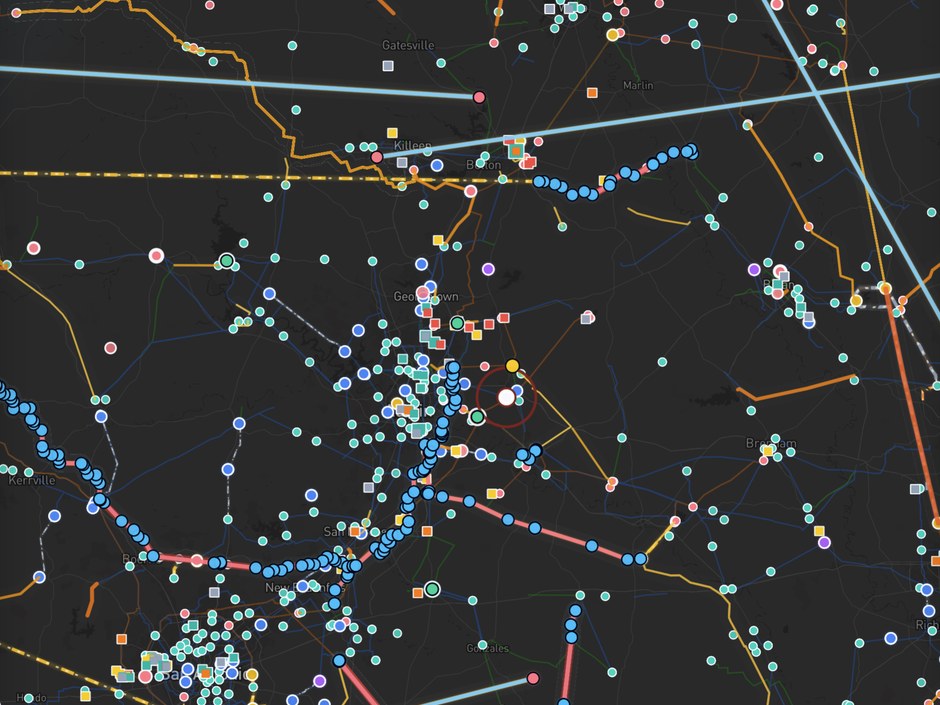
Data centers, substations and generation in one catalog
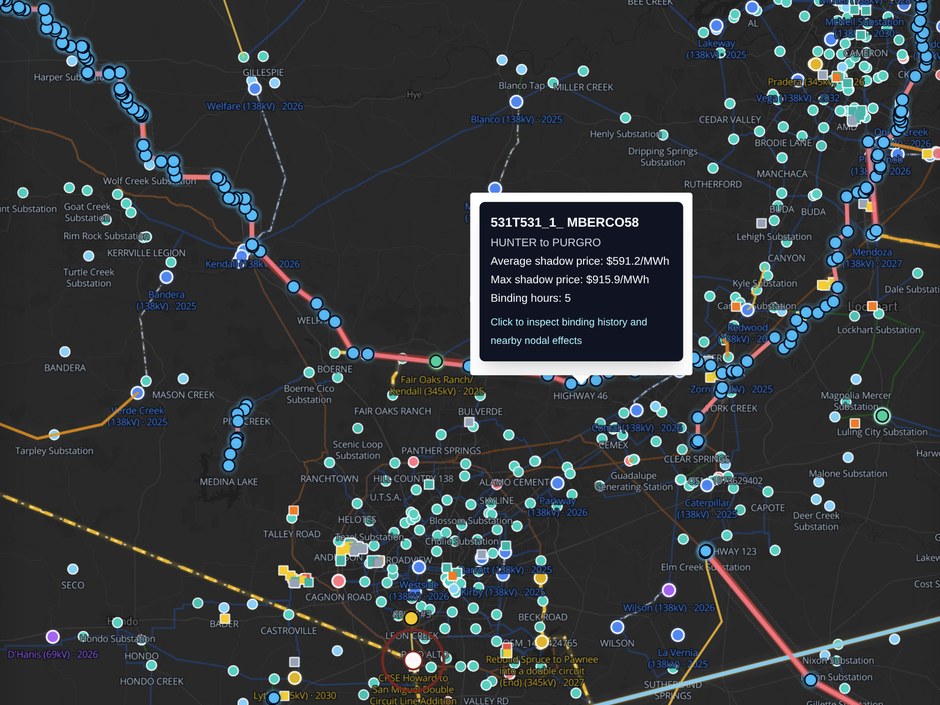
Grid congestion, constraints and shadow prices
Constraint history at a single node
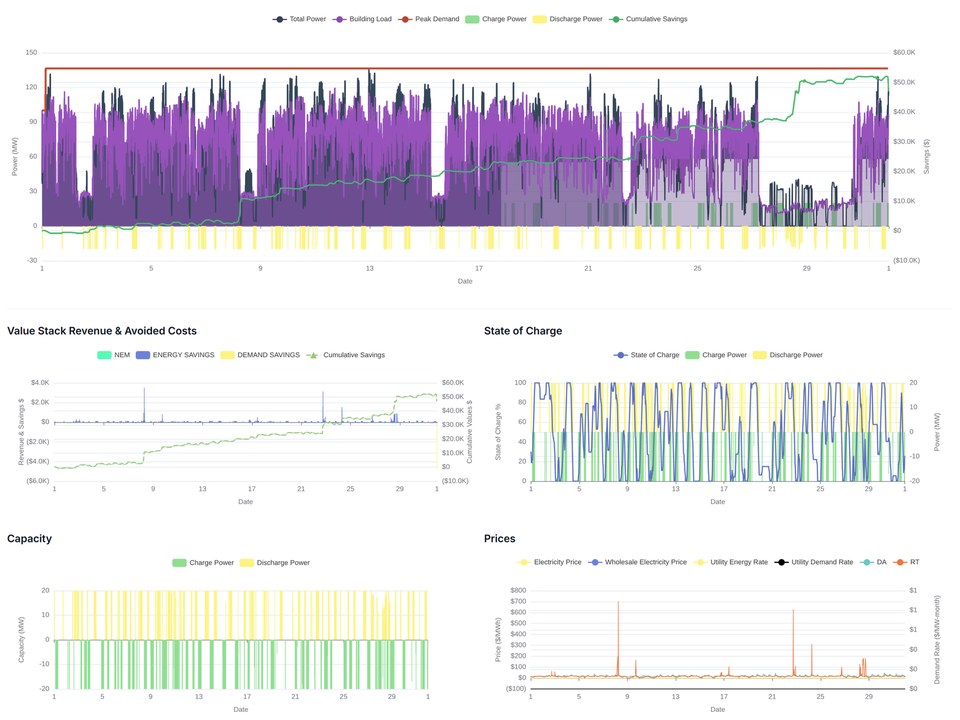
Optimized dispatch, state of charge and prices
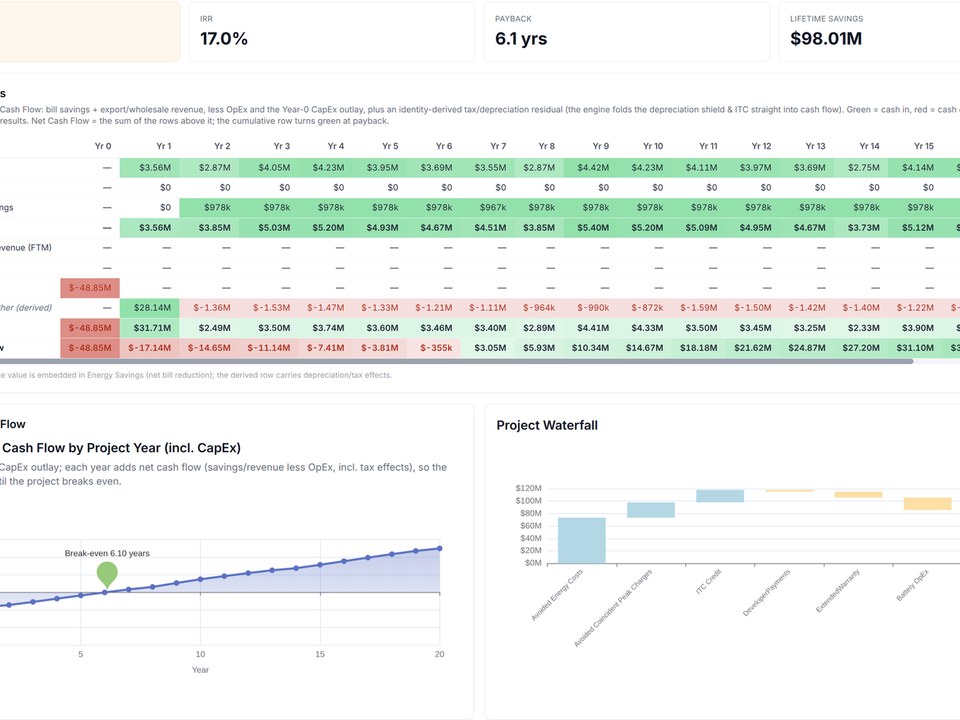
Project cash flow, net present value and payback
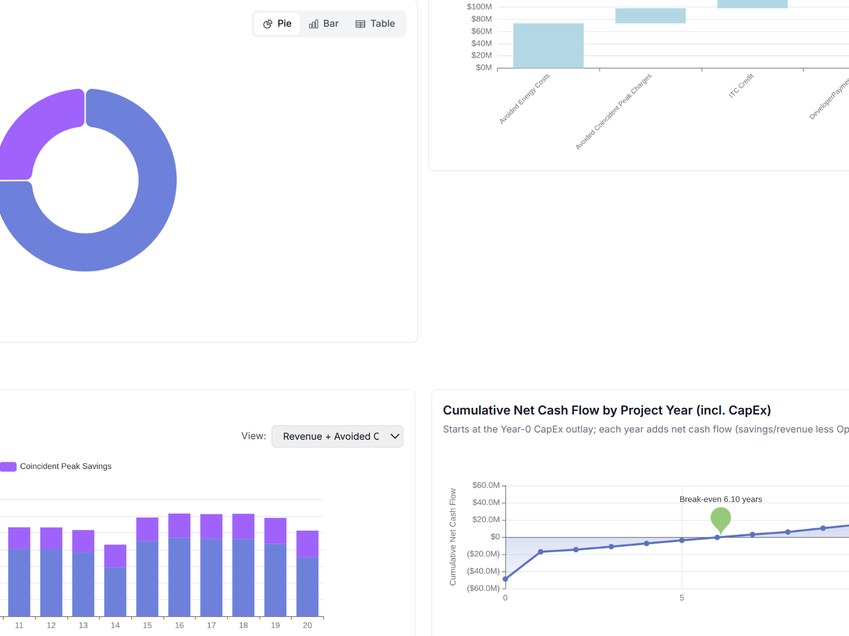
Revenue streams by project year

CAMPUS WORKLOADS

Whole campuses, modeled by what they run.

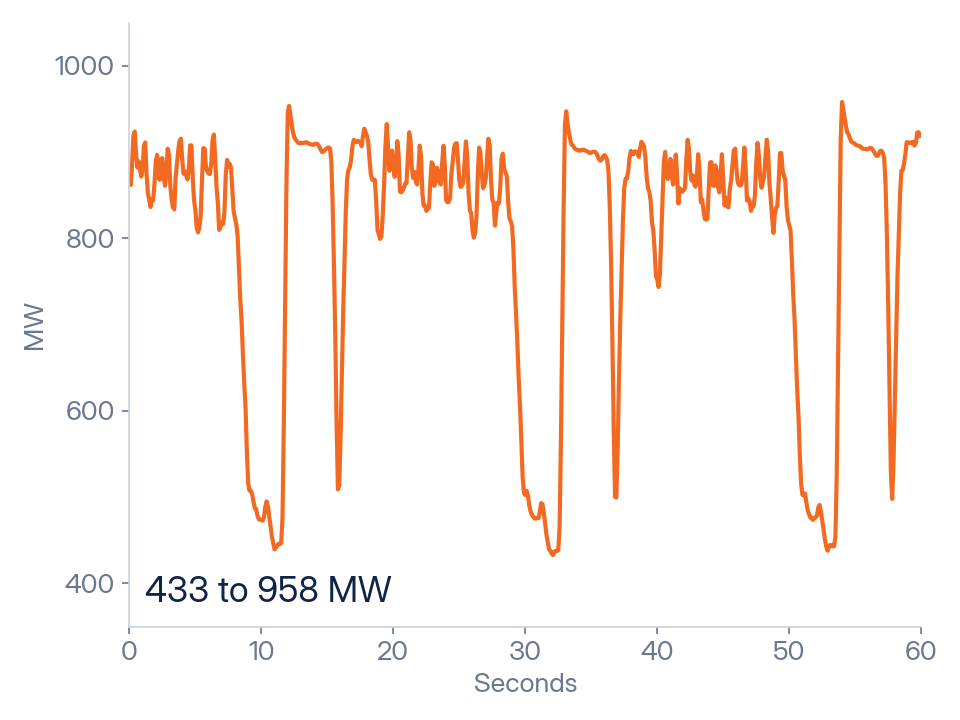
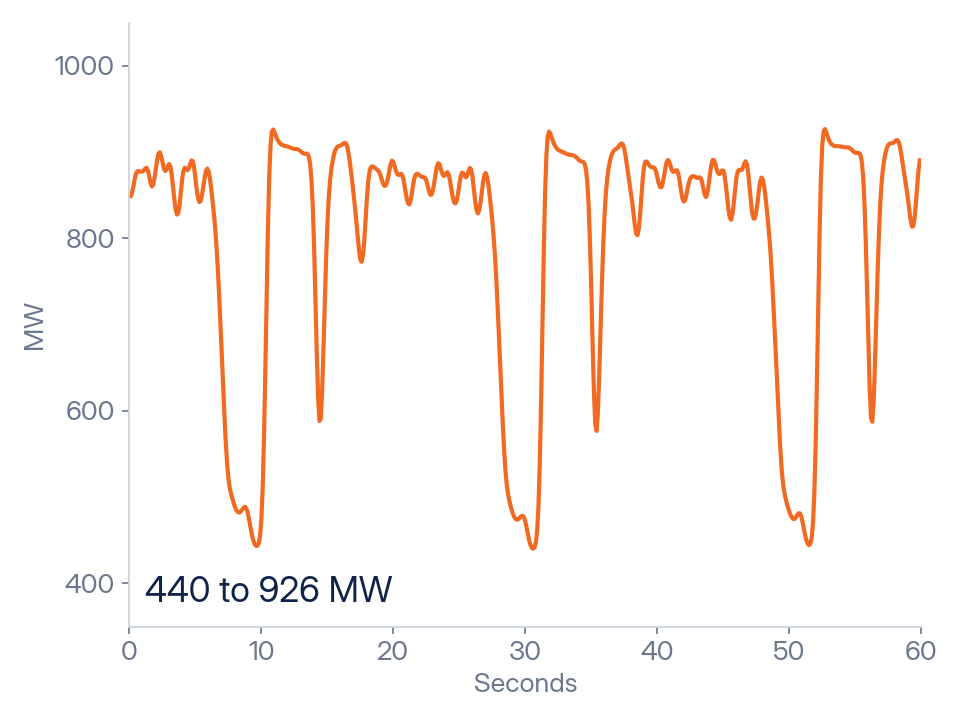
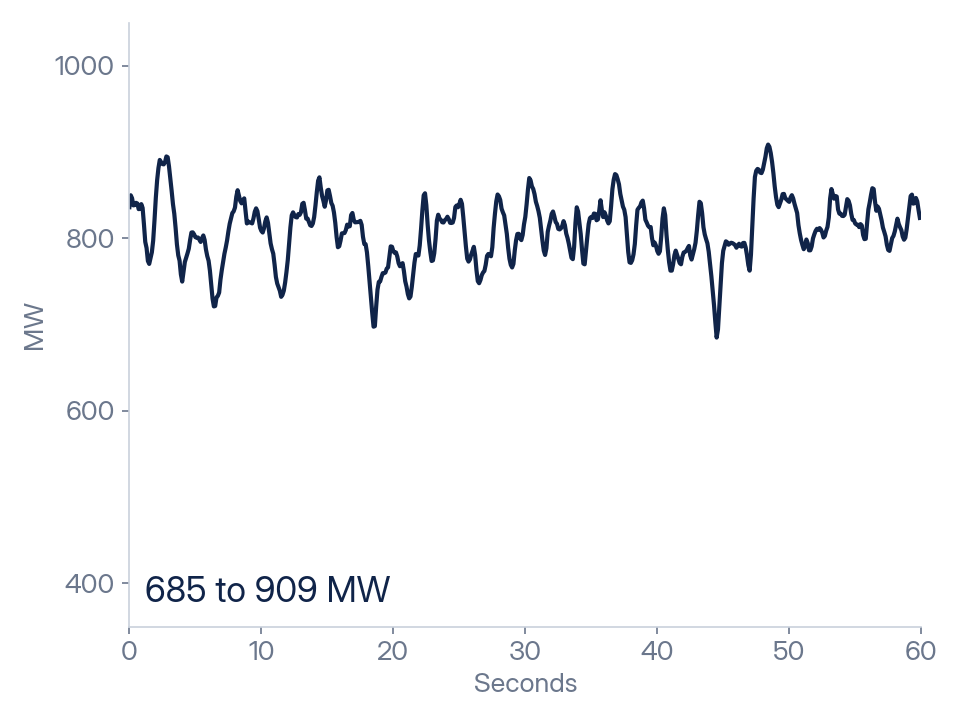
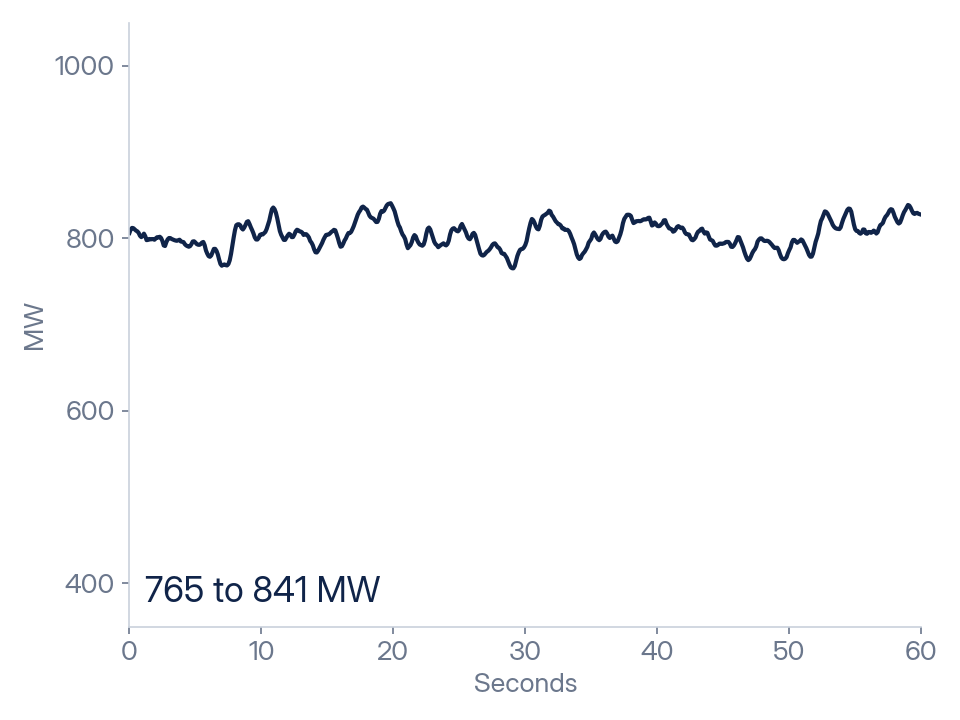
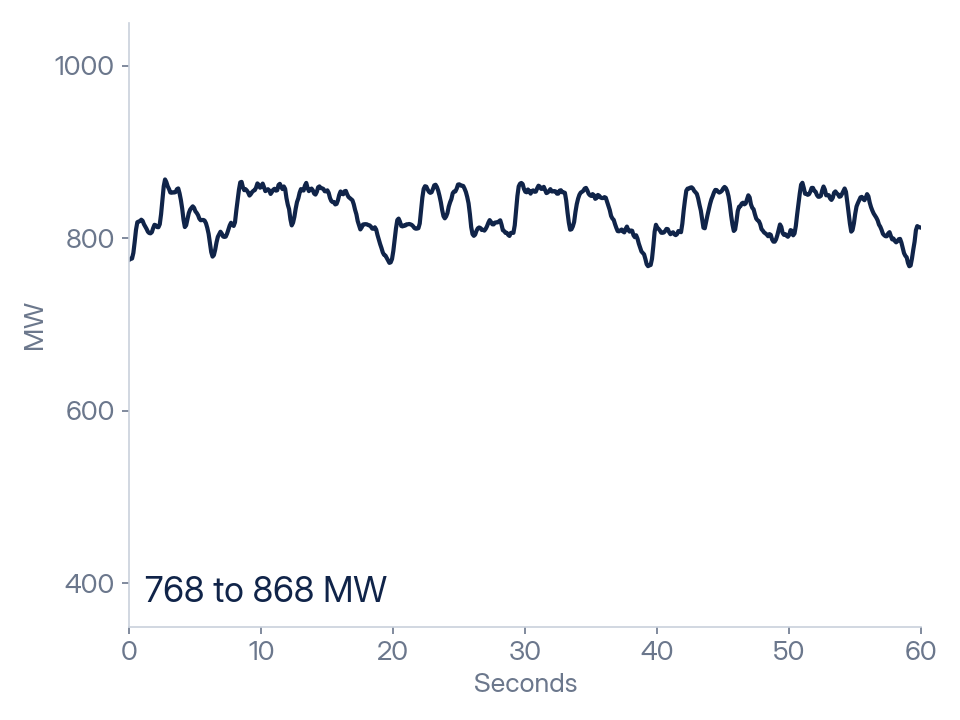
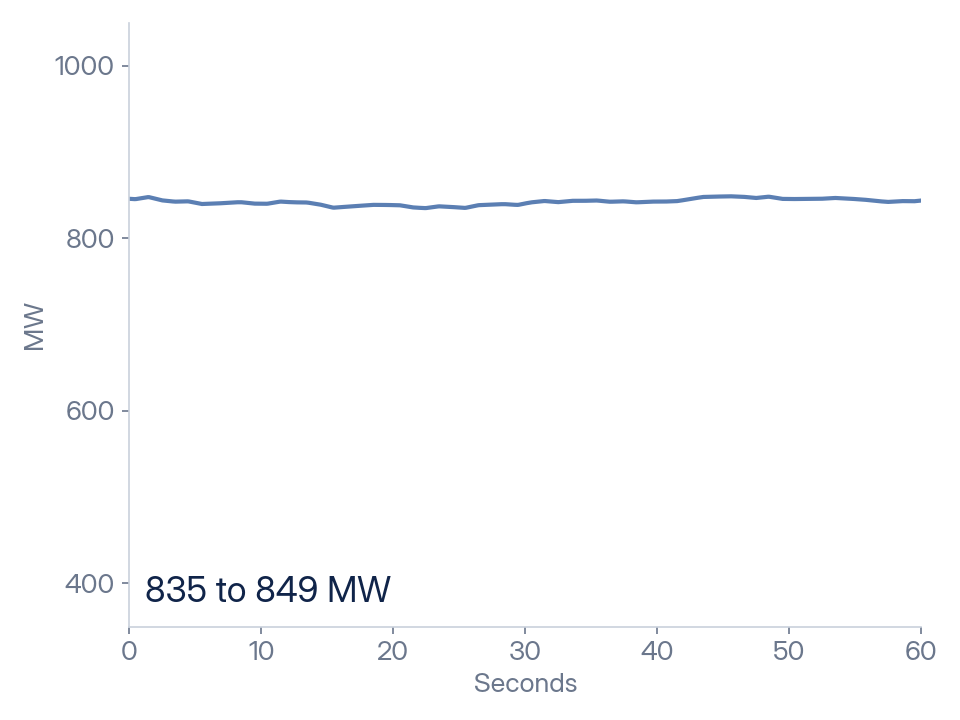
Energence models a whole campus by its workload. A campus running one AI training job moves as a single load. Many independent jobs average each other out, inference is steadier still, and most real campuses run a mix. Each thumbnail is one minute of the same simulated 1 GW campus, 600 MW of IT and 400 MW of cooling and mechanical load, run a different way.

The workload sets the battery’s duty, so the study starts here. The data center power smoothing page takes the hardest case, one job across the campus, through the full simulation.

AI training, one job across the whole campus
The same job with 200 ms of timing spread between halls
AI training, eight independent jobs
AI training, one hundred independent jobs
Mixed campus, three halls training and seven serving inference
AI inference only
AI inference only

01 / ADVANCED MODELING

The project and the operating duty in one model.

Energence brings project planning, energy data, modeling and optimization into one platform. Its models evaluate front-of-the-meter and behind-the-meter economics together. A project can serve load, hold backup reserve and participate in a market. The model accounts for how those duties compete for the same battery.
  • Scenario analysis across four coincident peaks (4CP), five coincident peaks (5CP) and twelve coincident peaks (12CP).
  • Energy arbitrage and ancillary services by market.
  • Front-of-the-meter and behind-the-meter economics in one model.
  • Tariff-accurate bill simulation.
  • Power smoothing, ramp rate and ride-through simulation at millisecond resolution.
  • Sizing and duration optimization.
  • Battery life and degradation curves.
  • Warranty-constraint modeling.
  • Eight North American markets modeled, with an operating fleet in ERCOT, CAISO and Mexico.

EIGHT NORTH AMERICAN MARKETS

ERCOT · CAISO · MISO · PJM · NYISO · ISO-NE · AESO · Mexico

Operating fleet: ERCOT, CAISO and Mexico. The remaining markets are covered by the modeling platform.

02 / POWER SMOOTHING

Series and parallel power flow at millisecond resolution.

The simulation runs the production control code in 1 ms steps and tracks the load, the grid draw, battery charge and discharge, and state of charge (SOC). The same campus is shown in both configurations.
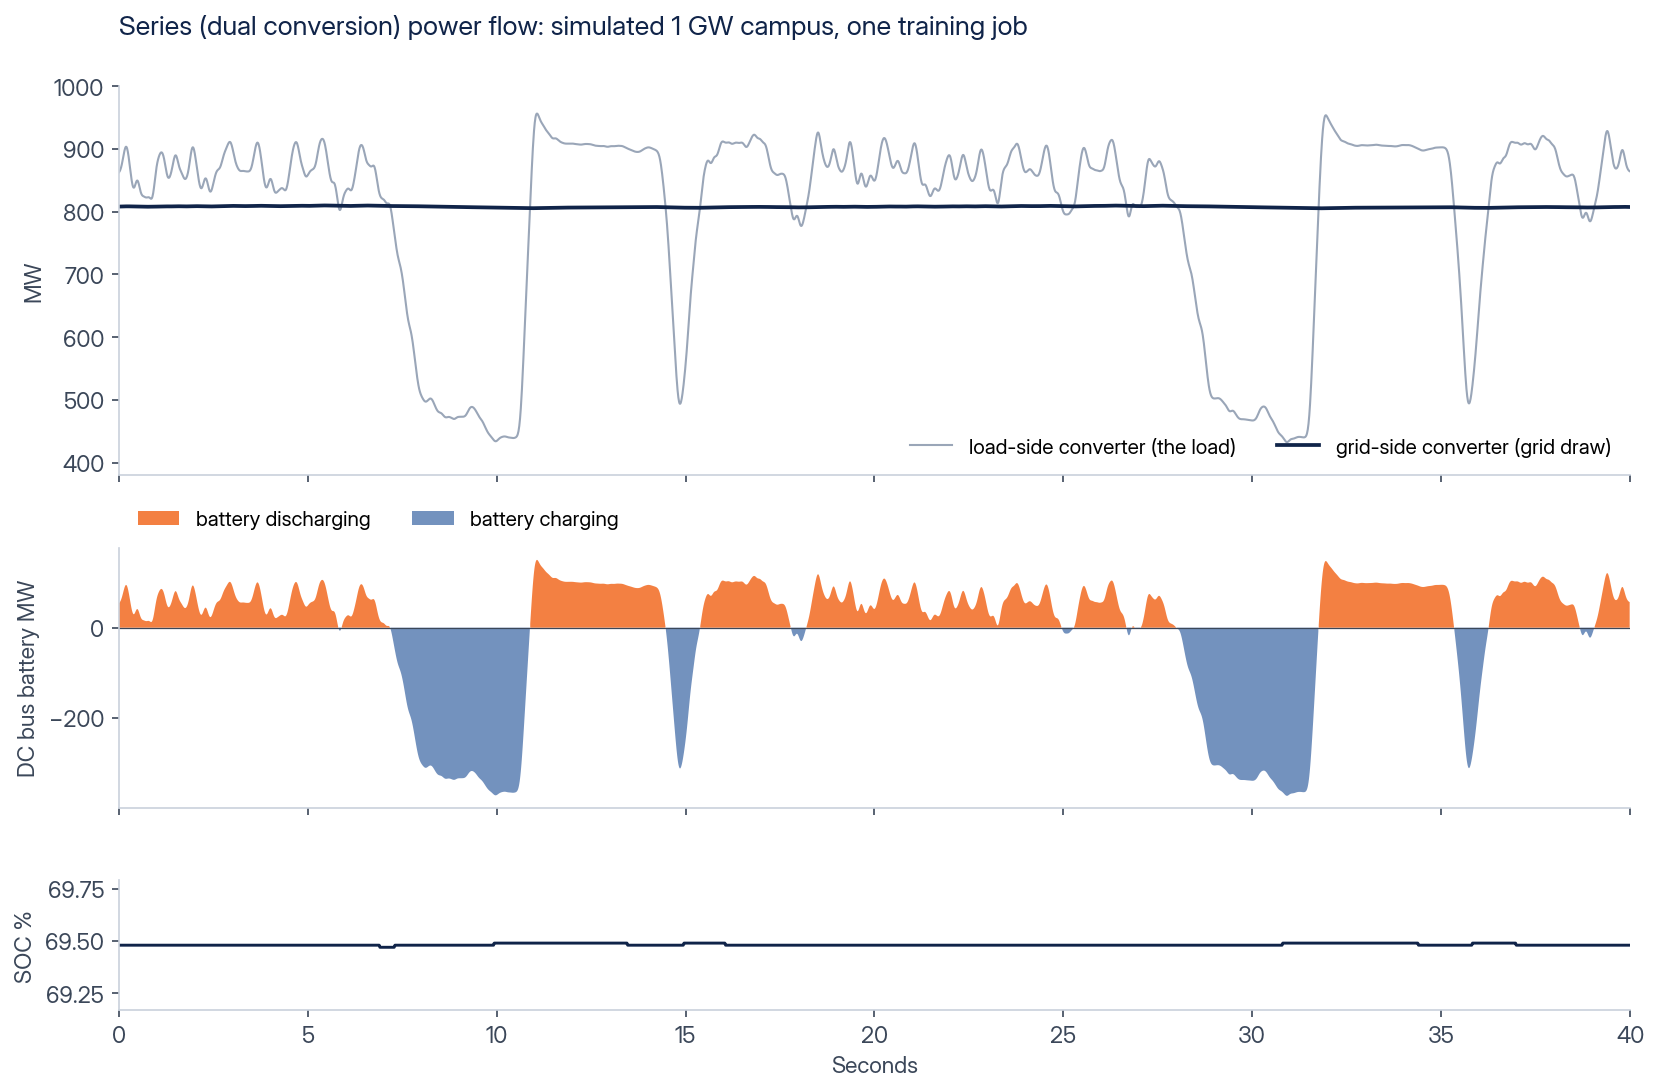
Series power flow, the dual-conversion configuration. The load-side converter serves the load, the grid-side converter draws a steady 805 to 810 MW, and the battery on the DC bus covers the difference. Simulated 1 GW campus running one training job, 1 ms steps, 40 seconds shown.
ENERGENCE / SERIES POWER FLOWSeries power flow, the dual-conversion configuration. The load-side converter serves the load, the grid-side converter draws a steady 805 to 810 MW, and the battery on the DC bus covers the difference. Simulated 1 GW campus running one training job, 1 ms steps, 40 seconds shown.

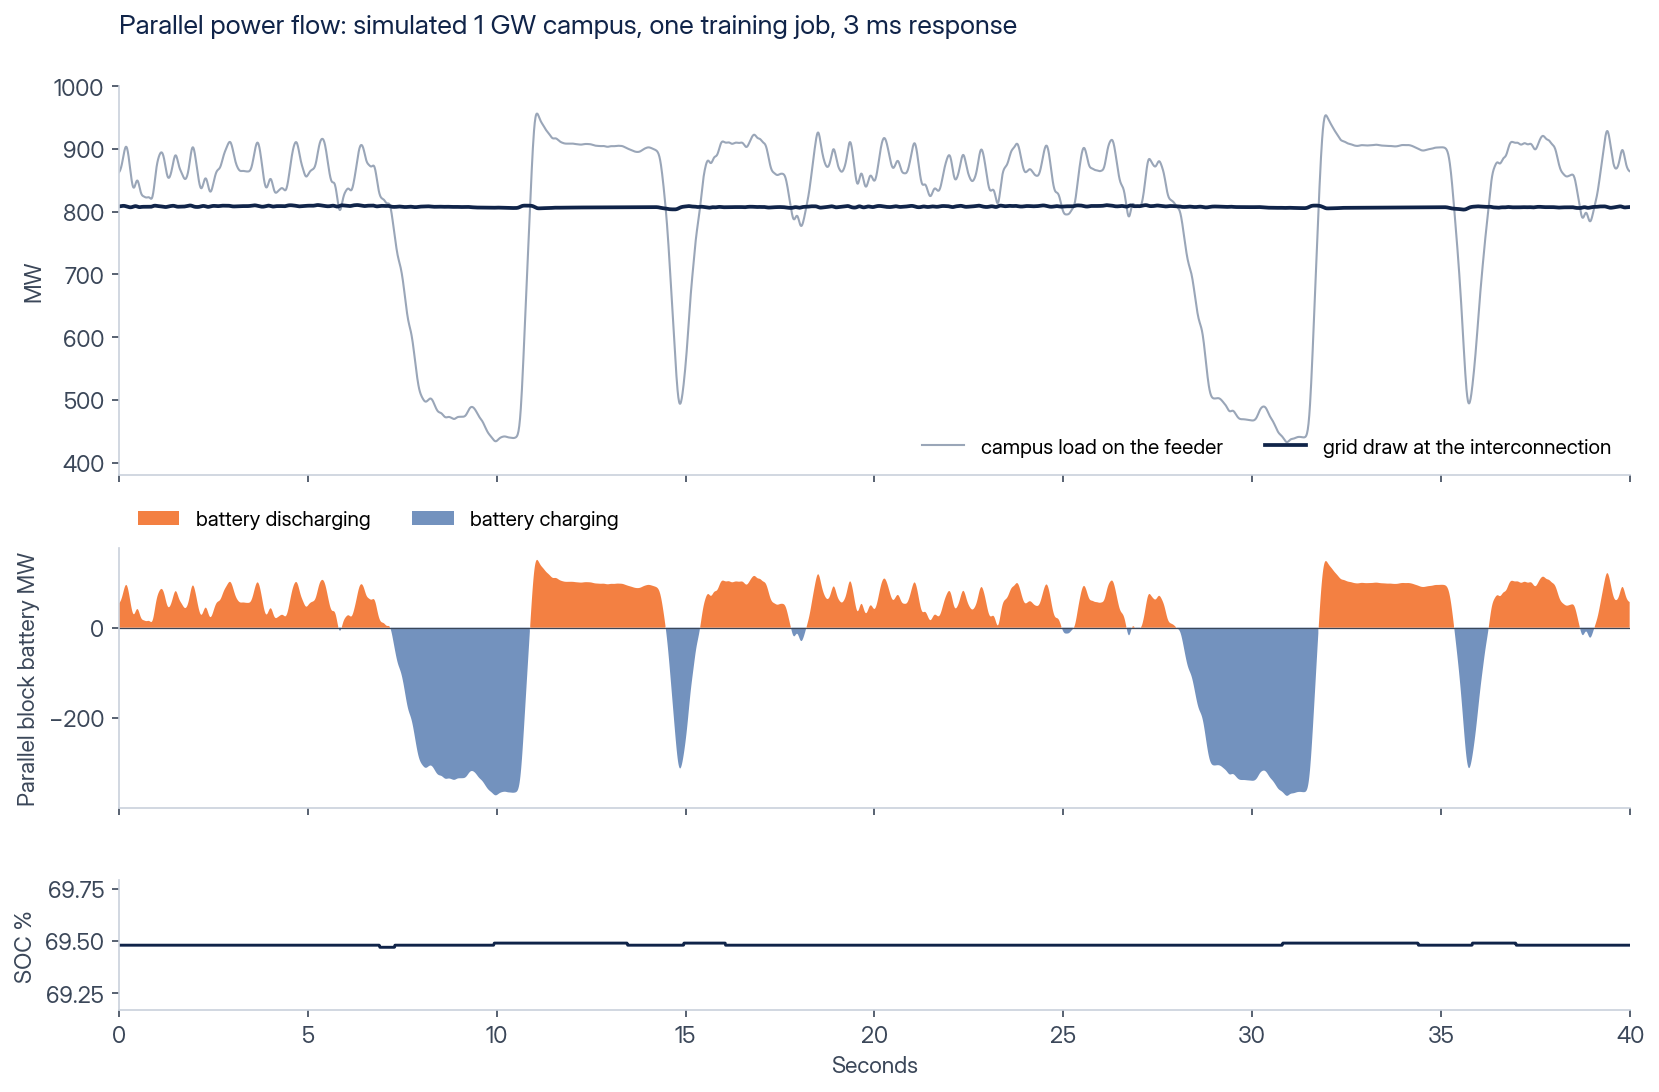
Parallel power flow. The load stays on the feeder, the parallel blocks inject and absorb the opposite of each pulse with a 3 ms response, and the grid draw stays between 803 and 811 MW. The same simulated campus and 40 seconds.
ENERGENCE / PARALLEL POWER FLOWParallel power flow. The load stays on the feeder, the parallel blocks inject and absorb the opposite of each pulse with a 3 ms response, and the grid draw stays between 803 and 811 MW. The same simulated campus and 40 seconds.

03 / RIDE-THROUGH

A grid voltage sag in both configurations.

The ride-through study takes a block through a voltage sag and reports when the site’s draw returns, against the grid operator’s recovery limits.
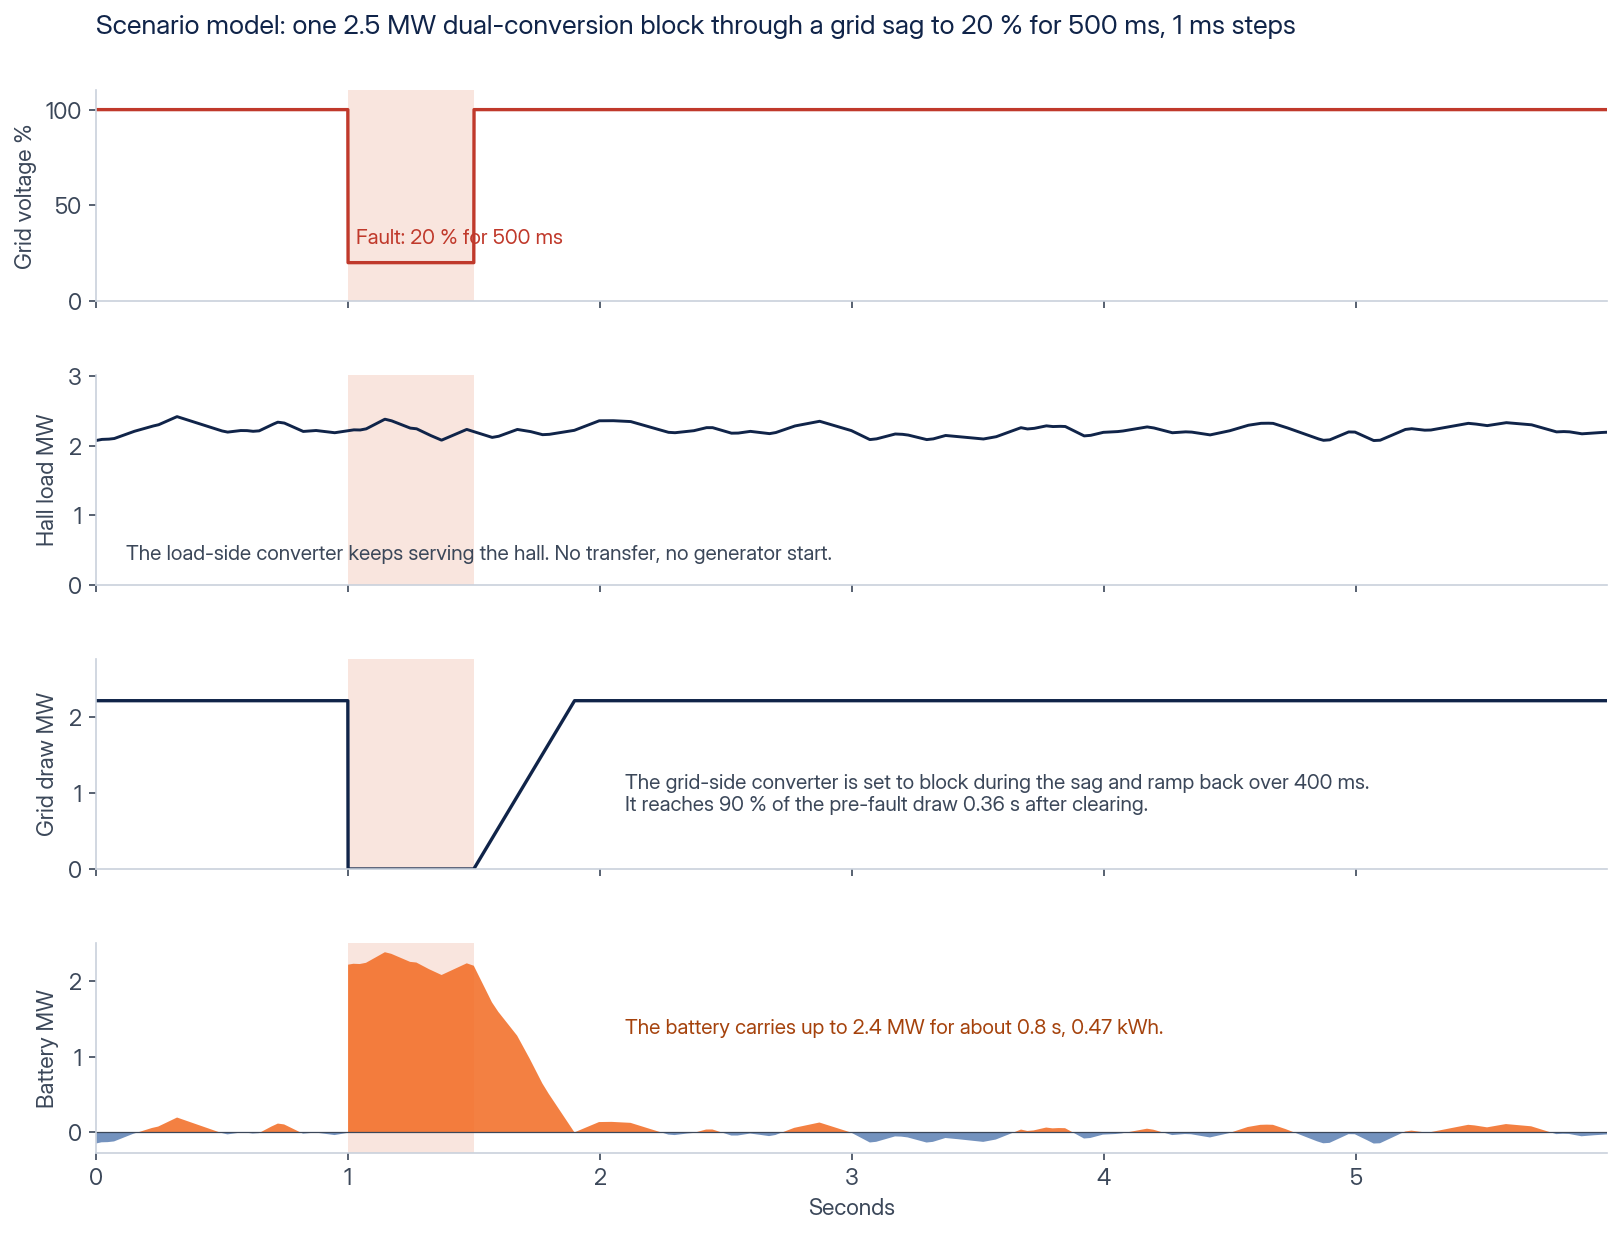
A scenario model of a 2.5 MW dual-conversion block through a grid voltage sag to 20 percent for 500 ms. The load-side converter keeps serving the hall, and the grid draw recovers to 90 percent 0.36 s after the sag clears.
ENERGENCE / RIDE-THROUGH SCENARIO, DUAL CONVERSIONA scenario model of a 2.5 MW dual-conversion block through a grid voltage sag to 20 percent for 500 ms. The load-side converter keeps serving the hall, and the grid draw recovers to 90 percent 0.36 s after the sag clears.

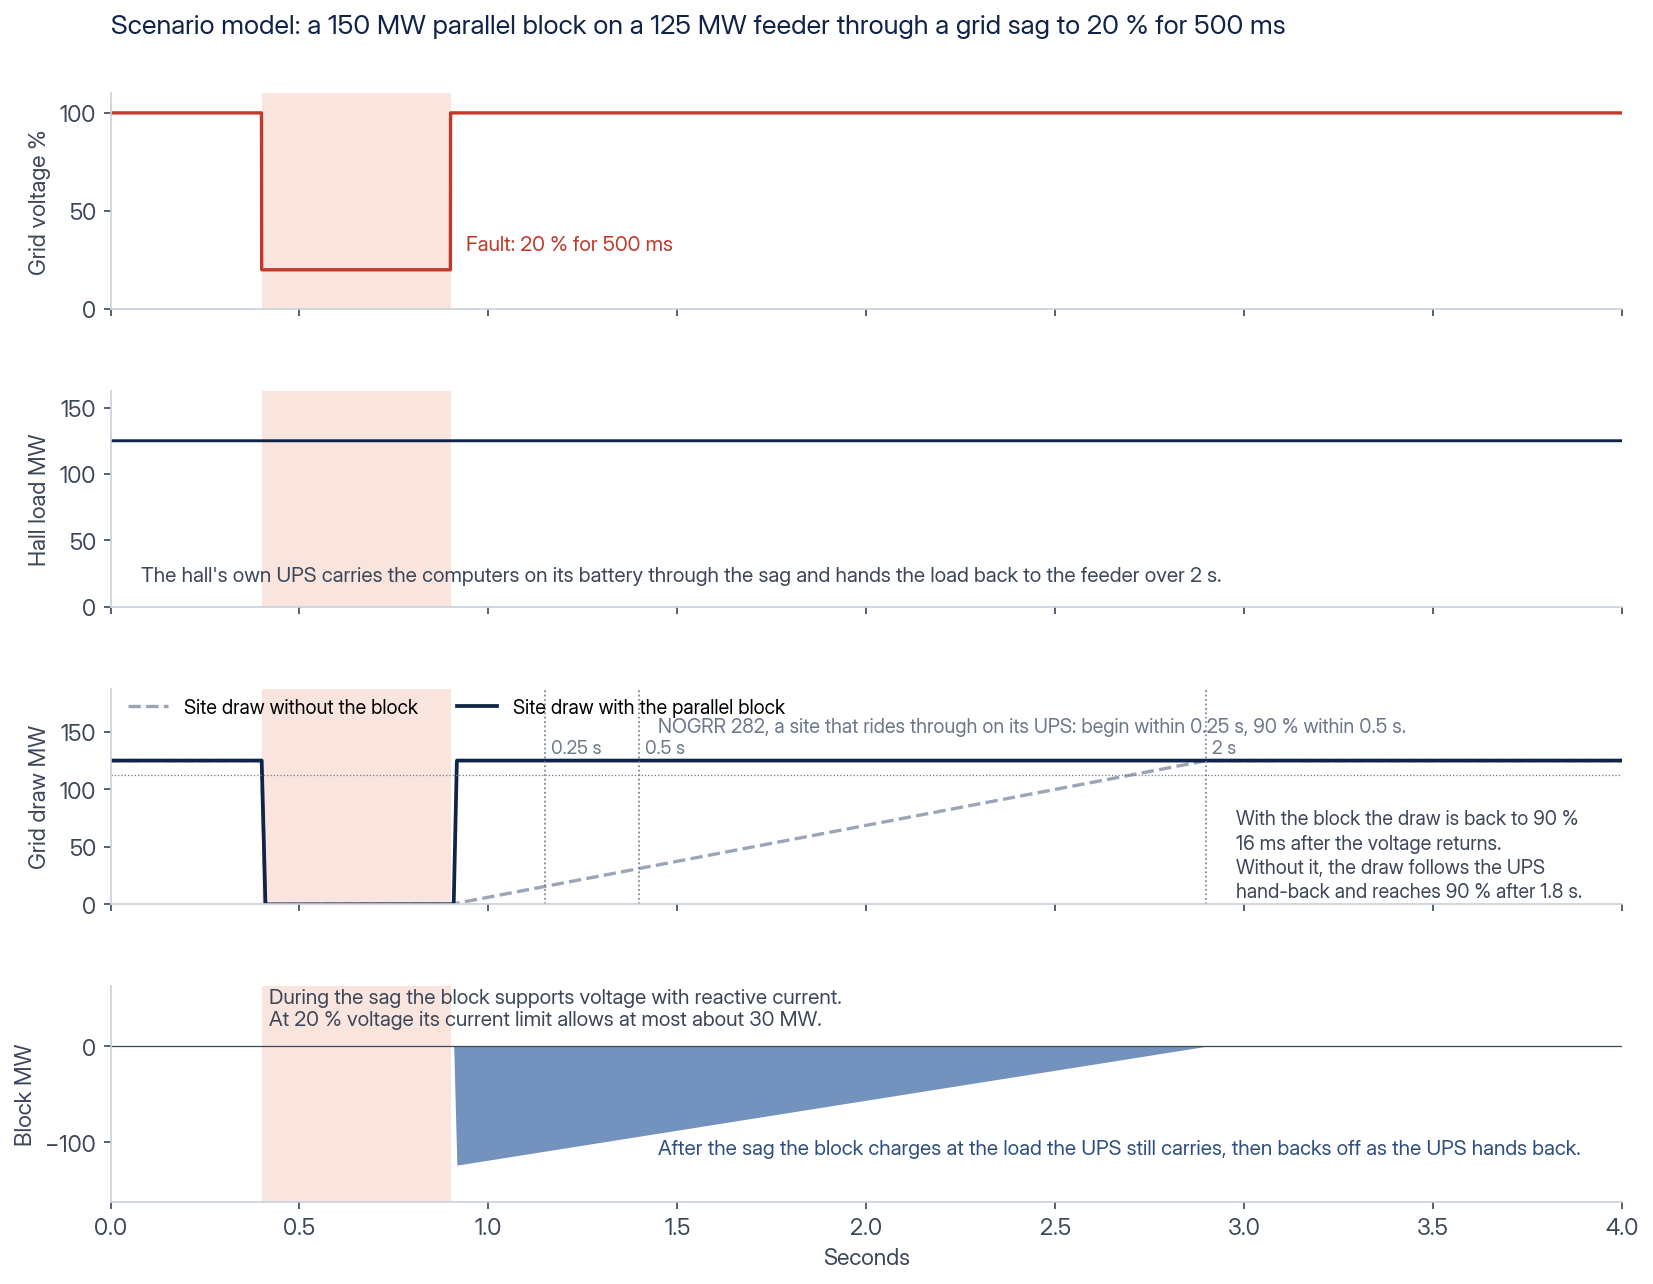
A scenario model of 150 MW of parallel blocks on a 125 MW feeder through the same sag. The hall’s UPS carries the computers, and once the voltage returns the blocks bring the site’s draw back to 90 percent in 16 ms. The UPS hand-back is assumed to take 2 s.
ENERGENCE / RIDE-THROUGH SCENARIO, PARALLEL BLOCKA scenario model of 150 MW of parallel blocks on a 125 MW feeder through the same sag. The hall’s UPS carries the computers, and once the voltage returns the blocks bring the site’s draw back to 90 percent in 16 ms. The UPS hand-back is assumed to take 2 s.

04 / LOAD STEPS

A whole campus steps off the grid and back.

The load-step study takes the largest step a site can make, the whole load leaving the grid and returning, and sizes the power and energy the battery needs to hold the grid draw through it.
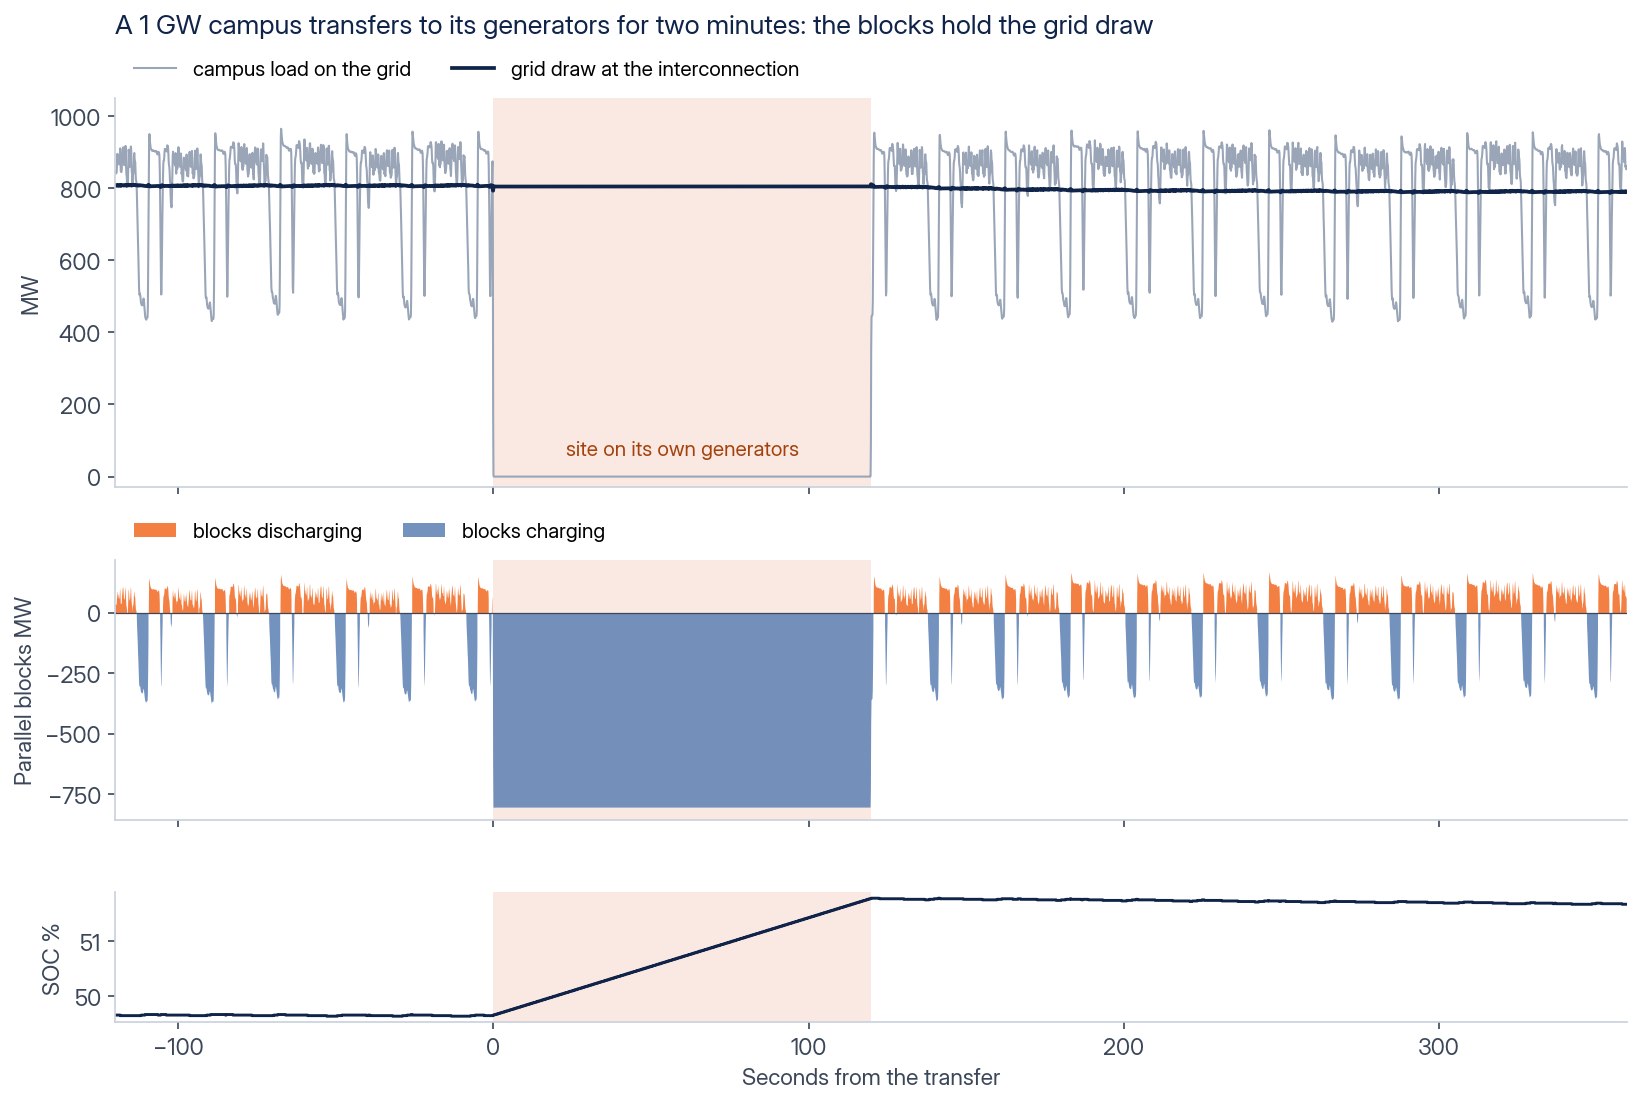
A simulated 1 GW campus running one training job transfers its whole load to backup generators for 120 seconds, then returns. The load on the grid drops from about 900 MW to zero and comes back in a step. Parallel blocks with a 3 ms response charge at about 806 MW through the transfer, so the grid draw stays between 787 and 811 MW, and the battery’s charge rises from 49.7 to 51.8 percent. Blocks of 1,200 MW and 1,200 MWh, 100 ms data.
ENERGENCE / LOAD STEP, SITE TRANSFERA simulated 1 GW campus running one training job transfers its whole load to backup generators for 120 seconds, then returns. The load on the grid drops from about 900 MW to zero and comes back in a step. Parallel blocks with a 3 ms response charge at about 806 MW through the transfer, so the grid draw stays between 787 and 811 MW, and the battery’s charge rises from 49.7 to 51.8 percent. Blocks of 1,200 MW and 1,200 MWh, 100 ms data.

Modeling and optimization applies the platform to sizing studies, tariff-accurate bill simulation and comparisons of operating strategies. Battalion EMS brings site control into the same project conversation.

05 / DATA CENTER VIEWER

The site and the power study in one platform.

The data center viewer connects site layout and energy data to the study. A layout on satellite imagery provides the physical context. The siting study screens the connection capacity available to the load, and the campus planning view compares connection scenarios on cost and availability.

AI data center studies use this context to compare the distribution, ride-through requirement and operating duty. Request information about using Energence for your project.

YOUR PROJECT

Request information

Tell us what you are evaluating. An engineer will review your request.

Use your company domain. Personal email providers are not accepted.

By submitting, you agree that Battalion may contact you about this request.