ERCOT has proposed a power variation limit for large computational loads. The peak-to-peak change in a site’s active power, filtered to keep everything from 0.1 Hz to 55 Hz, may not exceed 10 MW in any rolling 5-second window. ERCOT presented the proposal to its Large Load Working Group in February, April and June 2026 and said it would file the revision request in the second quarter of 2026. As of October 5, 2026 no revision request carrying the limit appears in ERCOT’s list of pending requests, so the limit is a proposal and its final wording can still change.
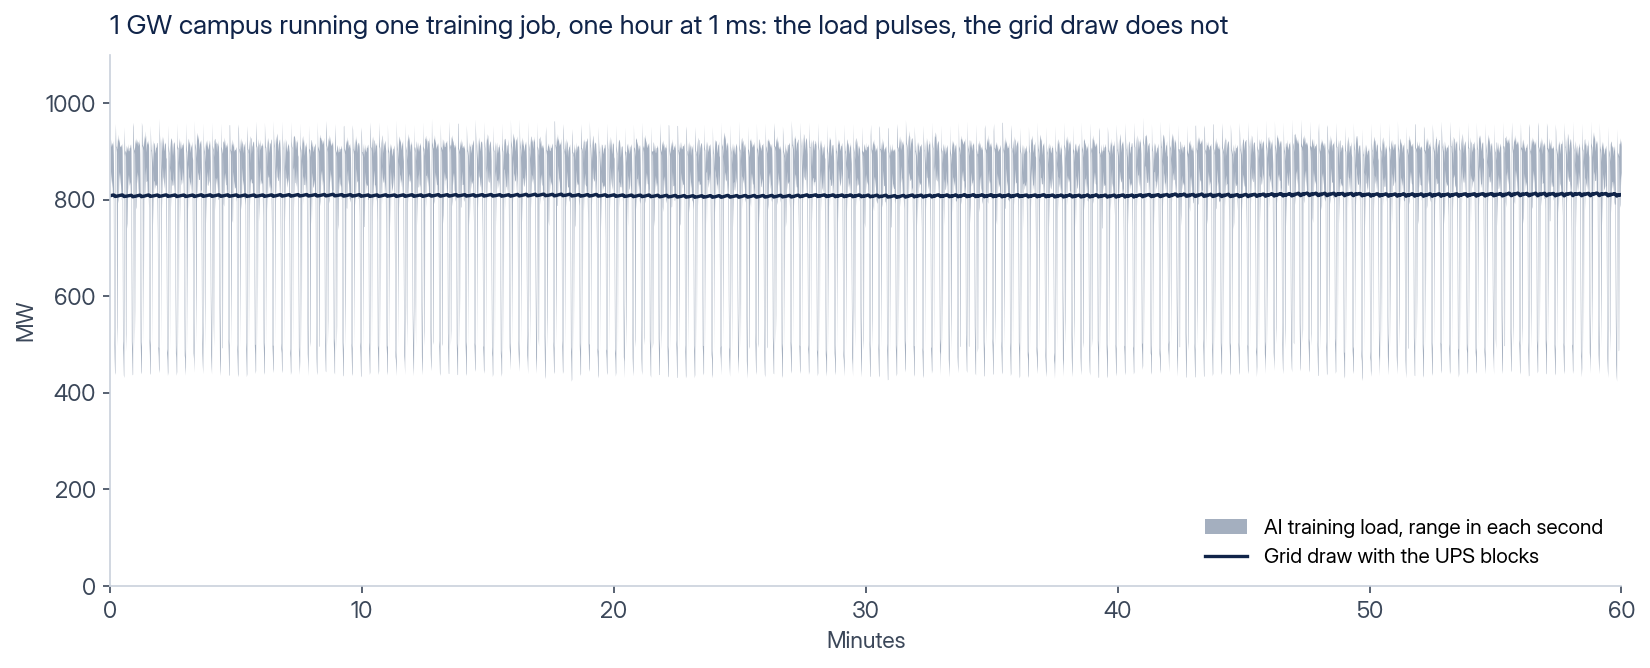
The number is small on purpose. In our simulation of a 1 GW AI campus running one training job, the load swings by about 500 MW every 20 seconds or so. Ten megawatts is 1 percent of that campus. The study ERCOT commissioned names energy storage, hardware and software as the ways to get there, and a battery between the load and the grid is the one that does not change how the computers run.
AI training moves power in square pulses
A training job runs the same cycle again and again: every GPU computes, then they all wait to exchange results, then they compute again. Power follows the cycle. It rises to the cluster’s peak during compute and drops during the exchange, in steps measured in milliseconds, every 20 seconds or so, thousands of times a day. When one job spans a campus, the whole campus moves together.
Why ERCOT cares: generator shafts are springs
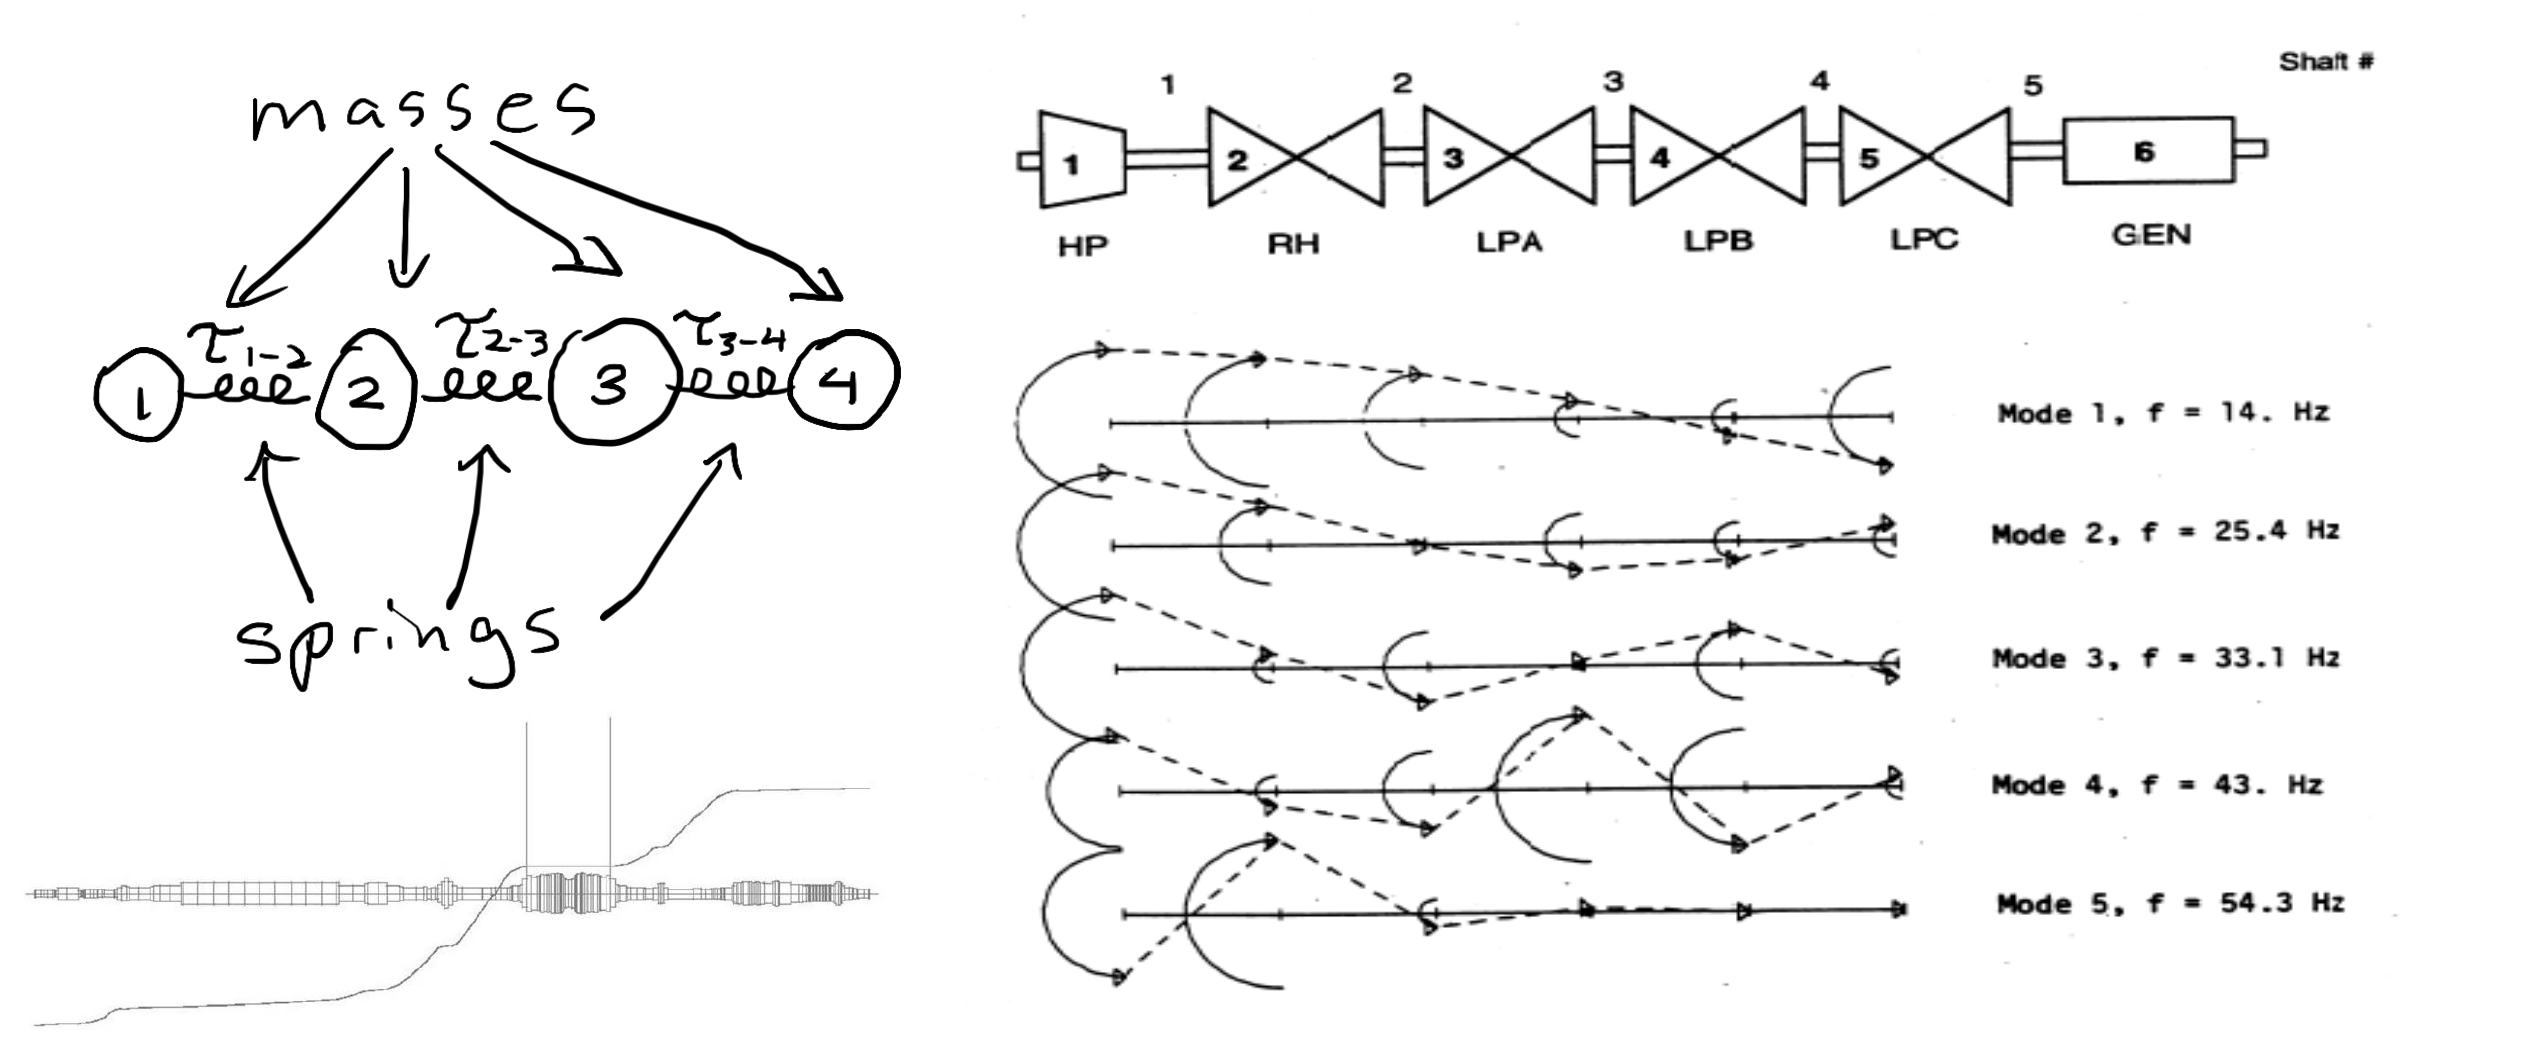
ERCOT’s concern is the large spinning generators near these loads. A turbine-generator shaft is a row of heavy masses (the turbine stages and the generator) joined by long steel shafts that twist like springs. Each shaft has natural torsional frequencies. In ERCOT’s example the five modes run from 14 Hz to 54.3 Hz. When the electrical load on the generator varies at or near one of those frequencies, the twisting builds up. That is called sub-synchronous oscillation. Cyclic twisting fatigues the shaft over months and years, and a strong resonance can break it.
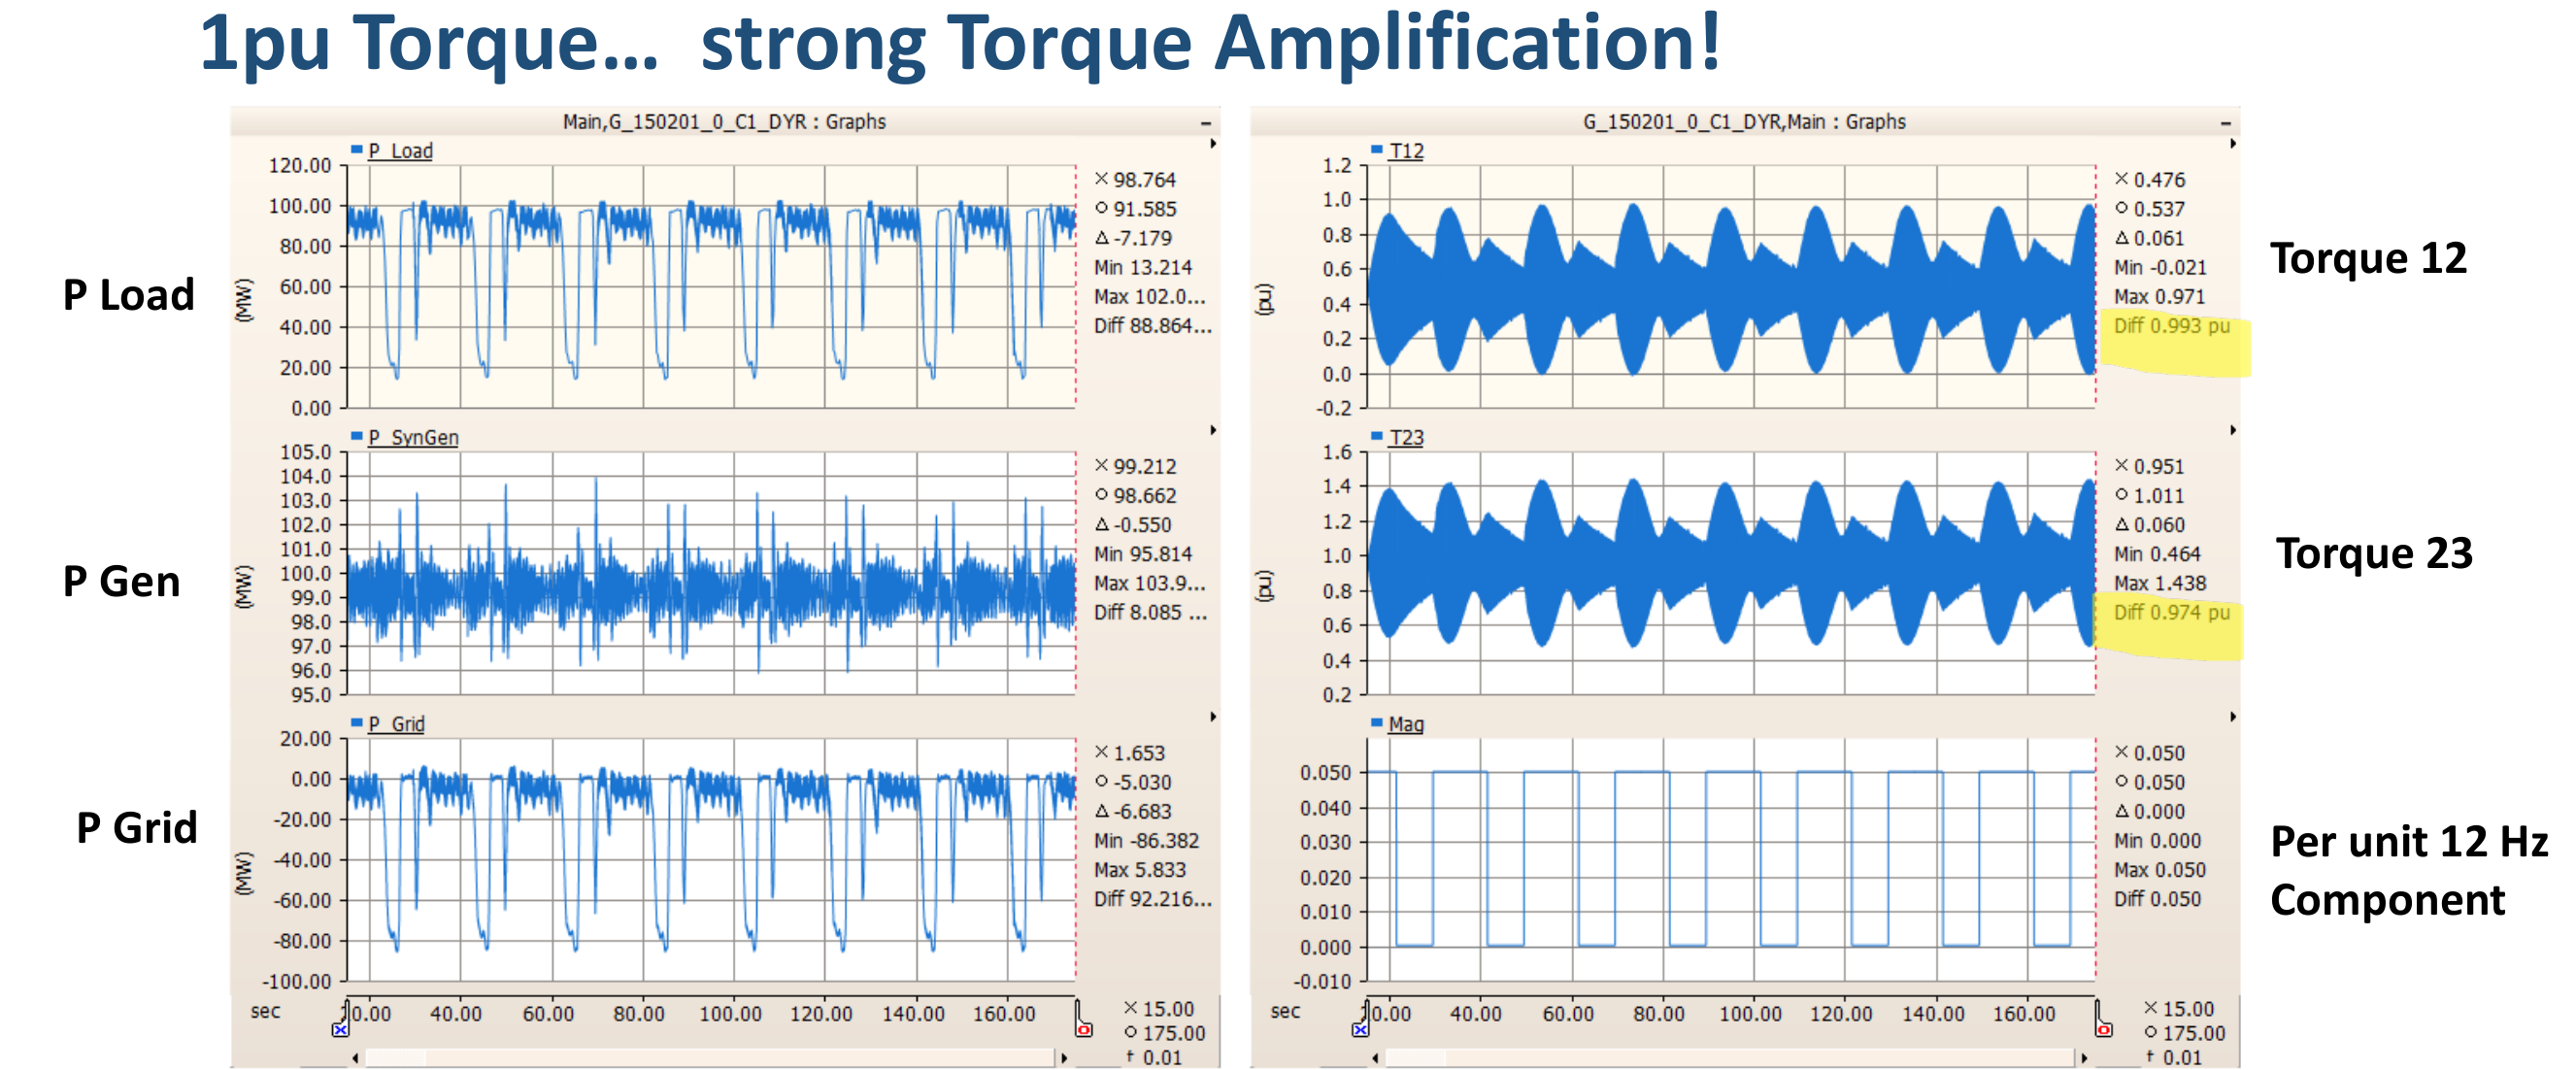
ERCOT hired Electranix, a power system studies firm, to measure the effect. In its October 2025 study a 100 MW generator with a 12 Hz torsional mode sat electrically close to a large load. A load following a measured AI training profile produced about 4 percent alternating torque on the shaft. The same profile with a 12 Hz component in it produced alternating torque of about 1 per unit, roughly the generator’s full rated torque, swinging back and forth. A square wave between 25 and 100 MW at 12 Hz produced more than 5 per unit. Electranix concluded that the risk depends first on the load’s cycling and ramping, and second on how electrically close the load is to the generator.
This is not only a simulation. ERCOT lists field events: a 23 Hz oscillation in ERCOT from July to October 2024 and, outside Texas, a 14.7 Hz oscillation traced to a data center, among others. The study’s own recommendation is direct: “Measures should be taken to mitigate software cycling via energy storage or hardware/software solutions. While perfect flatness is not required, active power must be sufficiently stable by the time it is introduced to the grid.”
Why the limit is 10 MW
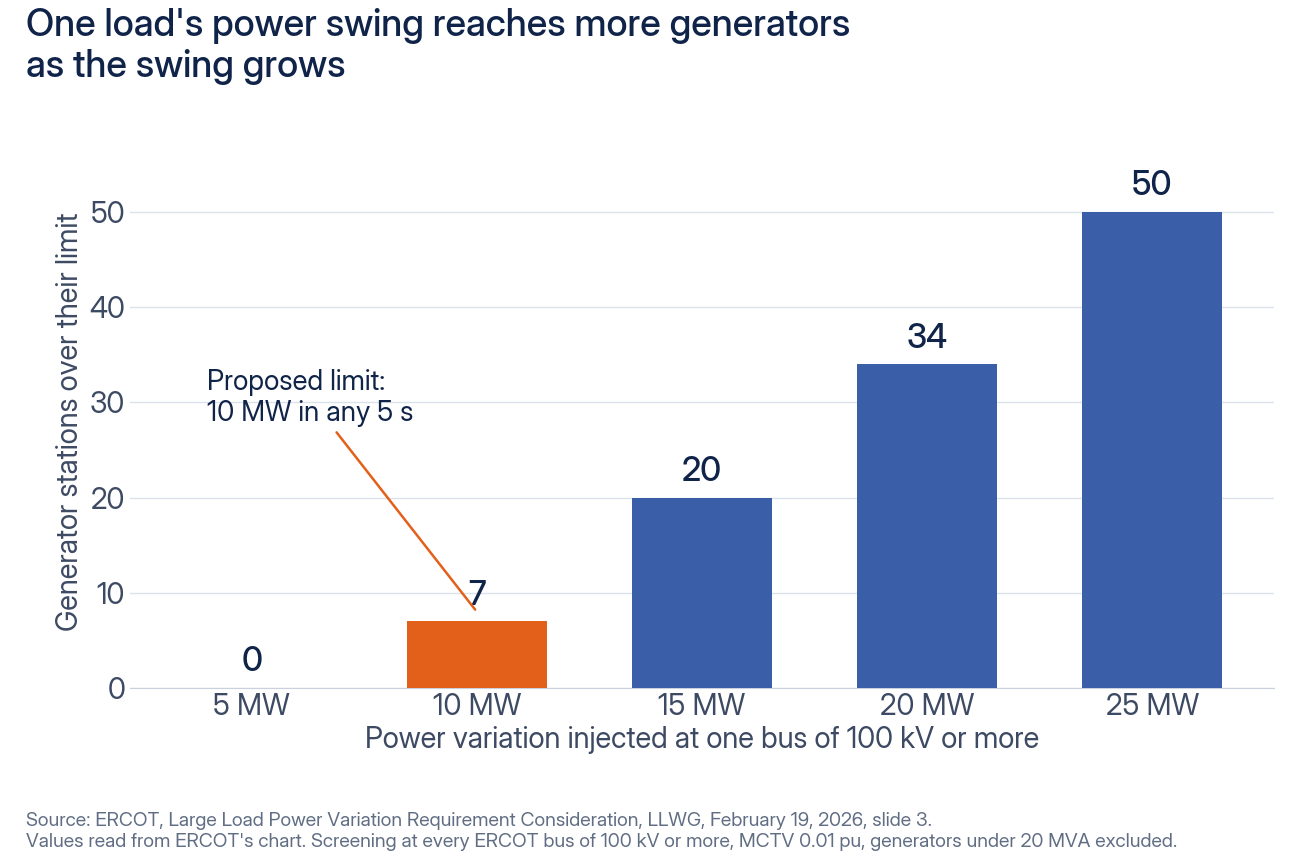
ERCOT injected power variation at every bus of 100 kV or more on its system and counted the generator stations pushed past an assumed limit of 1 percent of their rating, leaving out units under 20 MVA. At 5 MW no station was affected. At 10 MW, 7 were. At 15 MW, 20 were, and at 25 MW, 50 were. ERCOT’s reading is that raising the limit, even modestly, sharply increases how far one load’s swing reaches into the system.
ERCOT also chose a single number so that loads can connect without a site-specific study. A study of how one load interacts with nearby generator shafts needs detailed generator data that is often hard to obtain, and the studies grow quickly as the allowed variation grows. ERCOT weighed project-specific limits, a tiered approach and a uniform limit, and proposed the uniform 10 MW.
How compliance would be measured
The June 2026 proposed language reads: “The peak-to-peak value of active power variation, calculated using instantaneous voltages and currents and filtered to preserve frequency components from 0.1 Hz to 55.0 Hz, shall not exceed 10 MW over any rolling 5-second interval.”
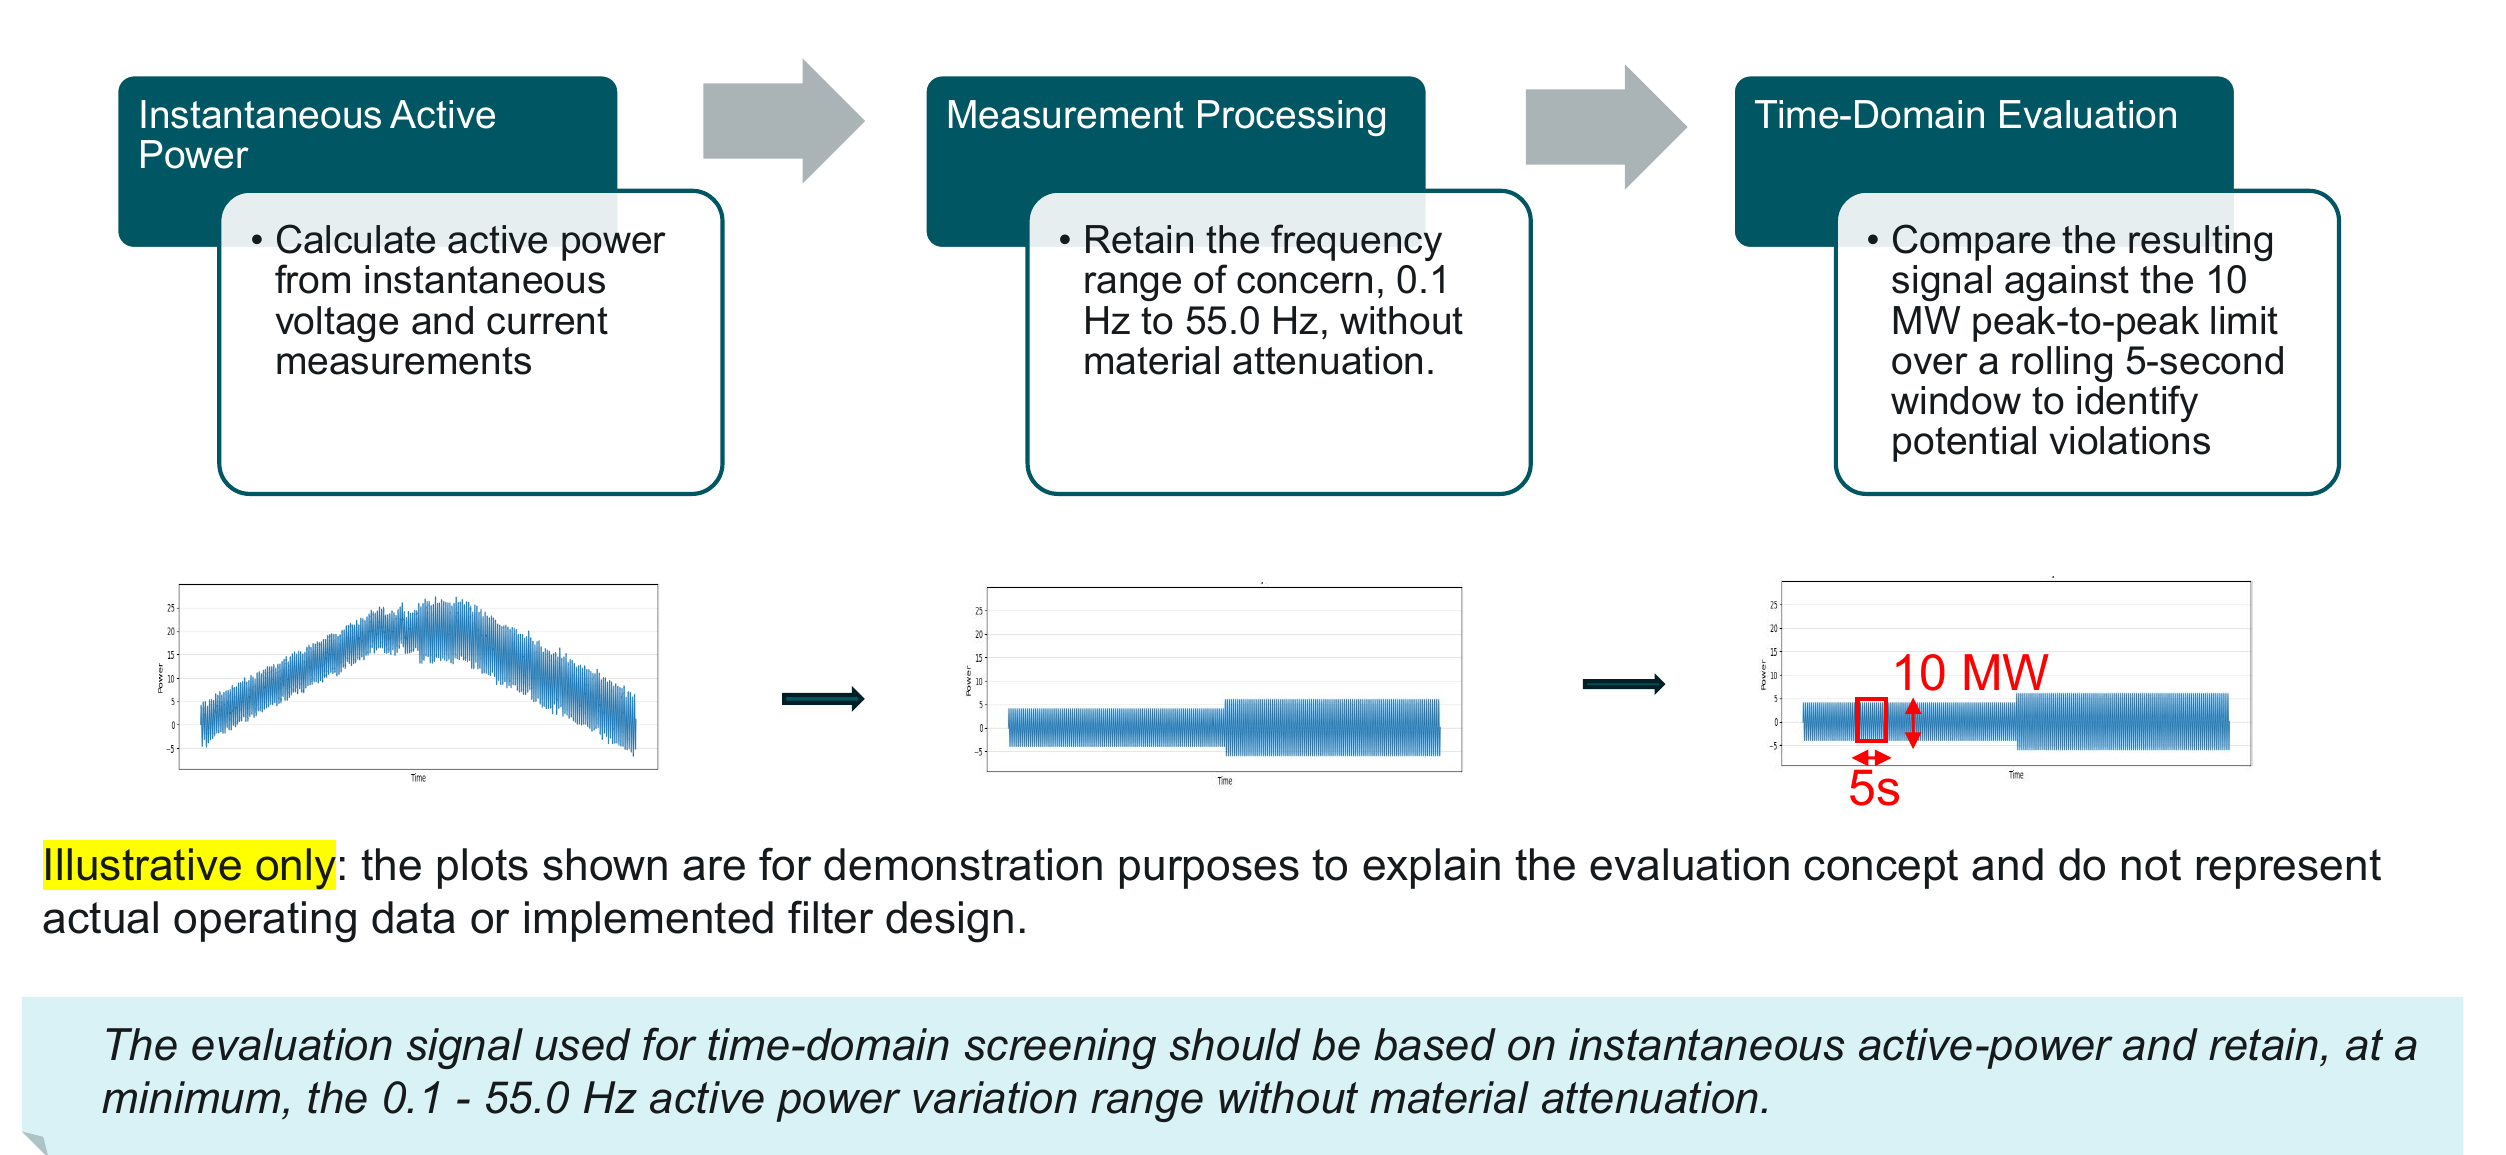
Three points follow from ERCOT’s slides. The band from 0.1 to 55 Hz covers both slow inter-area swings and the torsional frequencies of generator shafts. ERCOT said in February that its focus is repetitive cycling above 10 MW, and that an infrequent step above 10 MW would not violate the criterion. Measuring it needs fast recording. ERCOT said in April that phasor measurement units may need more than 30 samples per second, that fault recorders may need new triggers, and that it is working with transmission owners on that monitoring.
| Site | Typical training swing | Ratio to the 10 MW limit |
|---|---|---|
| 120 MW AI hall, four independent jobs | 49 MW in 5 s on the filtered metric (our simulation) | about 5 times |
| 1 GW campus, one training job | 424 MW to 971 MW (our simulation) | about 55 times |
How a battery meets the limit
A battery block on the medium-voltage bus absorbs the training pulses and the grid sees a flat draw. It discharges when the load rises and charges when it falls, so the sum of load and battery stays within the limit. We ran our production control code against the proposal at two scales, on a training load shape digitized from a published figure of a GPU training cluster (Choukse et al., arXiv 2508.14318, 2025) and interpolated to 1 ms for the simulation.
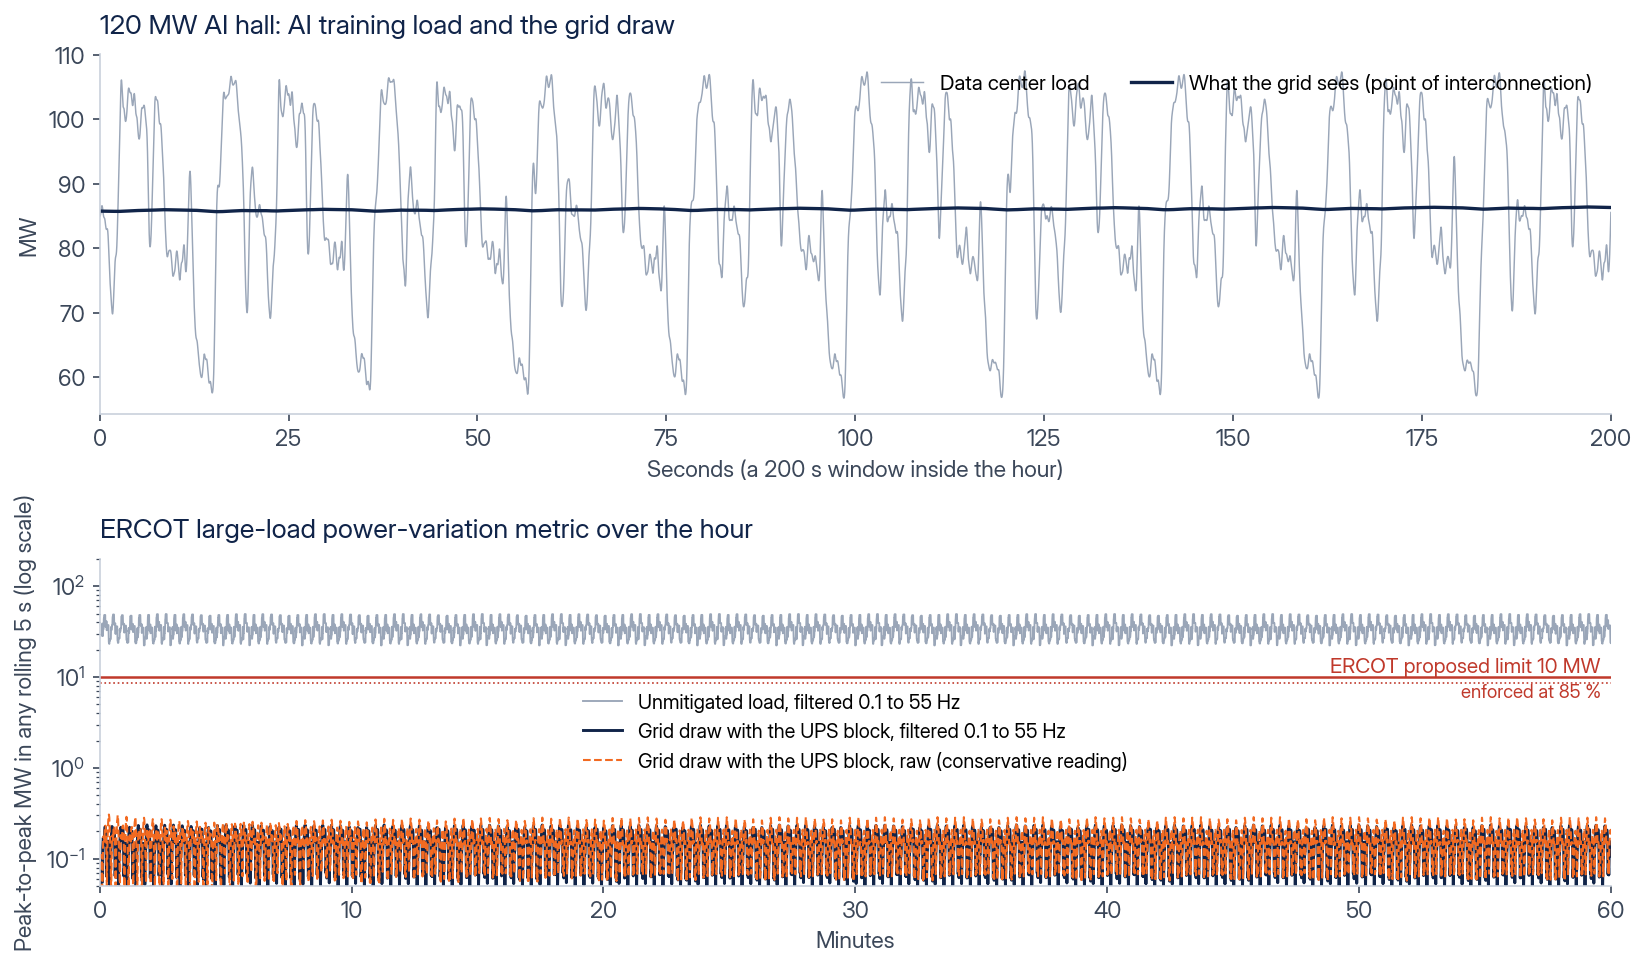
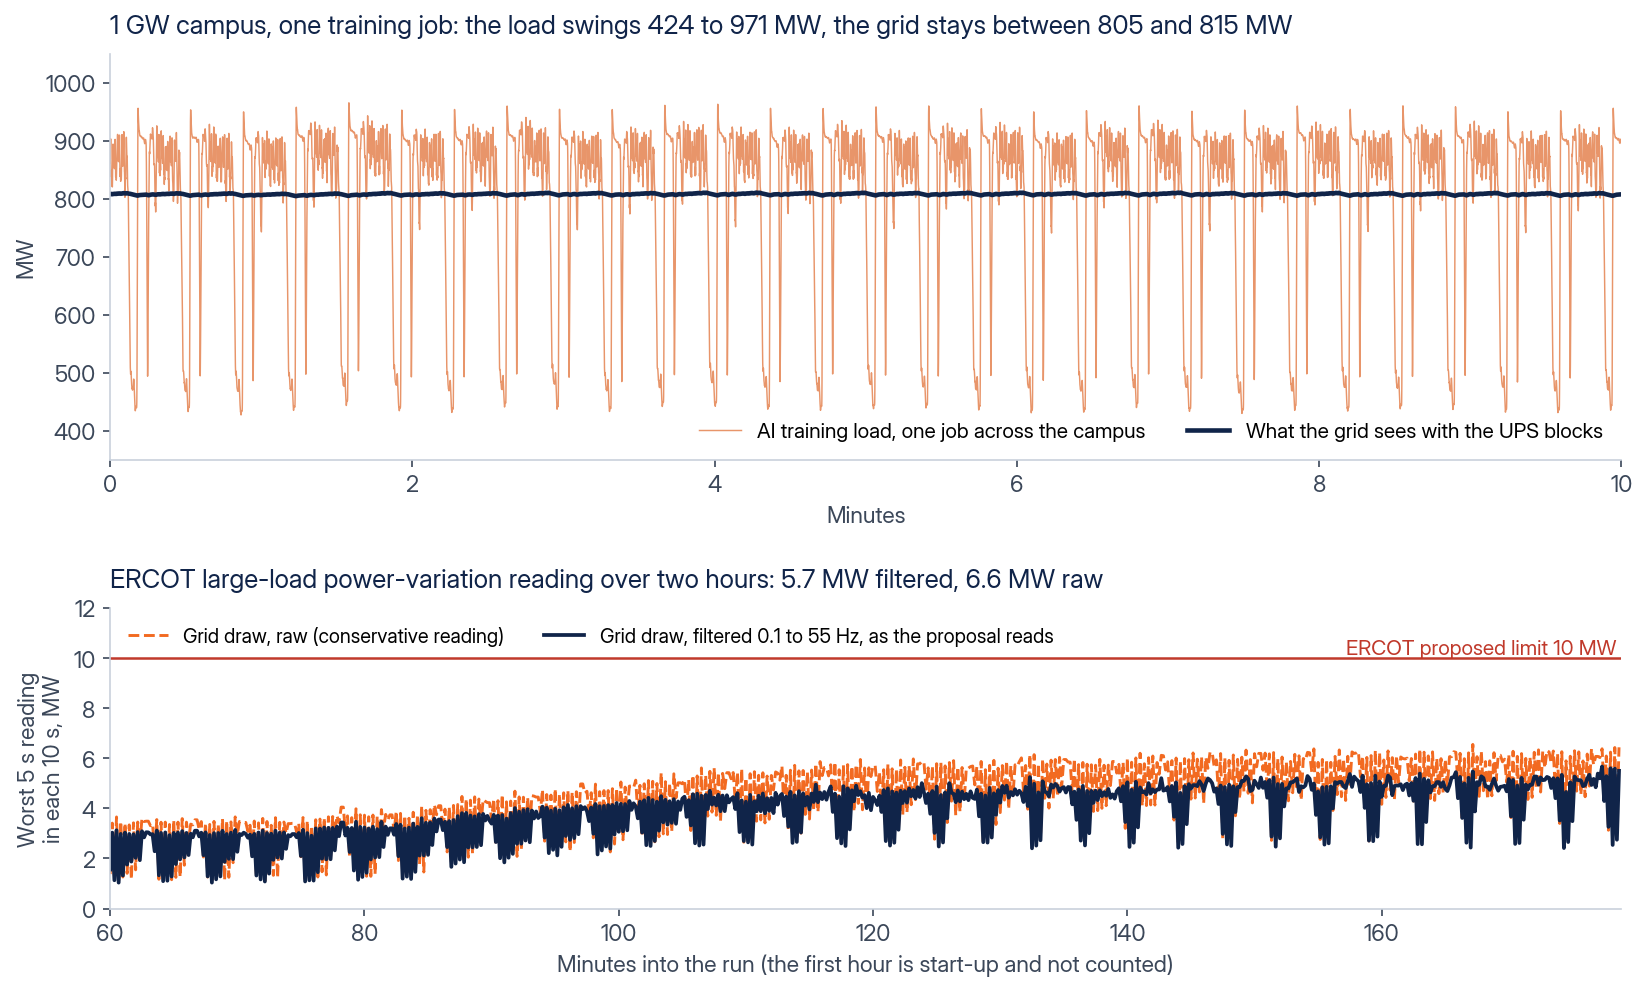
In a dual-conversion block the load-side converter serves the halls as a voltage source, and the grid-side converter draws a smooth average. In a parallel connection the blocks sit beside the load and inject the opposite of each pulse through a control loop, and in the same 1 GW case they give the same reading with a 3 ms total response. The raw, unfiltered reading is shown in both cases as the conservative bound, because the filter design is not yet set in a rule.
The same block also covers ride-through. ERCOT’s NOGRR 282 requires large computational loads to stay connected through grid faults, and the ride-through post explains why. The full simulation basis is on the data center power smoothing page. Send your load profile with its time resolution and the interconnection agreement, and request information to see your site simulated against the limit.
Sources
- ERCOT, Large Computational Load (LCL) Power Variation Limit Discussion, Large Load Working Group, June 19, 2026.
- ERCOT, LCL Power Variation Limit and Monitoring Requirement: Need and Discussion, Large Load Working Group, April 2026.
- ERCOT, Large Load Power Variation Requirement Consideration, Large Load Working Group, February 19, 2026.
- ERCOT, LEL Sub-Synchronous Oscillation Power Variation: Challenges and Discussion, Large Load Working Group, January 22, 2026.
- Electranix for ERCOT, Investigation into Vulnerability of Synchronous Machines to Large Load Subsynchronous Active Power Variation, Large Load Working Group, October 24, 2025.
- Choukse et al., Power Stabilization for AI Training Datacenters, arXiv 2508.14318, 2025, for the training load shape in our simulations.